
This graphic highlights the top product searches on Amazon in the U.S., providing a glimpse of what items American consumers are after. Read more
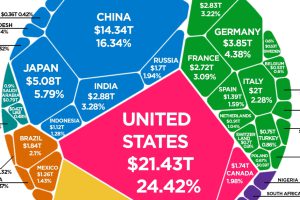
The world’s total GDP crested $88 trillion in 2019—but how are the current COVID-19 economic contractions affecting its future outlook? Read more

What values are the most influential in the world? Across 500,000 surveys in 152 languages, we visualize a rich dataset of human motivations. Read more
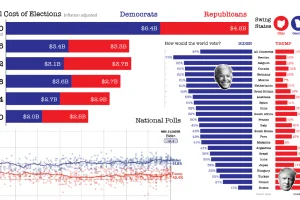
Buckle up your seatbelts—we look at 9 key data-driven charts to get you prepped for this consequential day in U.S. election history. Read more
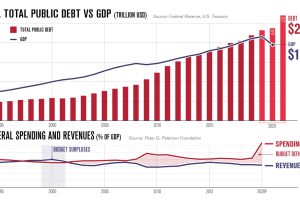
America’s debt recently surpassed $27 trillion. In this infographic, we peel back the layers to understand why it keeps on growing. Read more
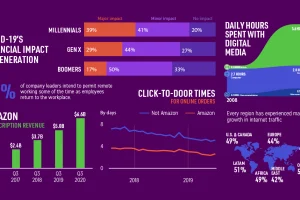
In some cases, COVID-19 has sped up societal and economic trends that were already in motion. Here we examine five examples. Read more

We’ve pulled together 6 reasons why our new coffee table style book Signals is the perfect gift to inspire and encourage this holiday season. Read more
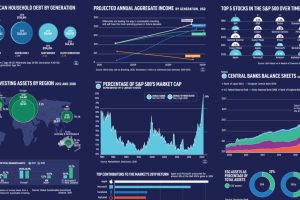
What forces will drive the future of financial markets? We reveal 15 charts from six chapters of our new book to show where the economy is heading. Read more
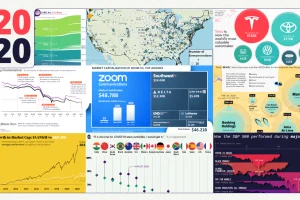
These 20 charts, maps, and visualizations help capture what happened in a tumultuous year around the globe. Read more
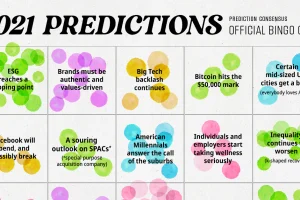
We analyzed 200+ articles, reports, and interviews to answer the question: Is there a consensus on what we can expect in 2021? Here are the results. Read more

