Every day, global trends are reshaping society and the business landscape. Here are 10 insights into how the world is changing—and where we are heading. Read more

There is $360.6 trillion of wealth globally. This graphic shows how it breaks down by country, to show who owns all of the world’s wealth. Read more
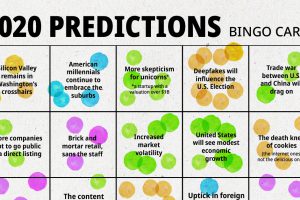
We analyzed 100+ articles, whitepapers, and interviews to answer the question: Is there a consensus on what we can expect in 2020? Read more
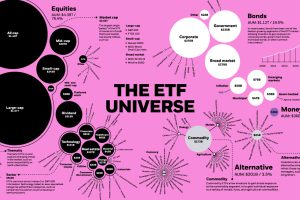
The global ETF universe has grown to be worth $5.75 trillion — here’s how the assets break down by type, sector, and investment focus. Read more
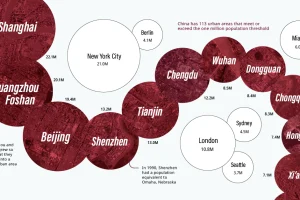
China has the same amount of 1 million+ population cities as both North America and the EU combined. Here they all are, from biggest to smallest. Read more
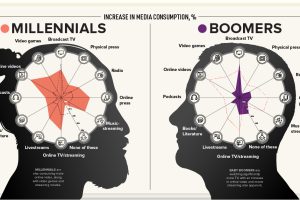
This visualization explores how each generation’s media consumption is changing amid the frenzy of pandemic-induced quarantines. Read more

This month on VC+: an in-depth roundup on investor psychology, a behind the scenes look at making our new book, and of course, The Trendline. Read more
With so much misinformation spreading on the pandemic, we’ve compiled a quality list of data-driven and unbiased COVID-19 resources for you to use. Read more
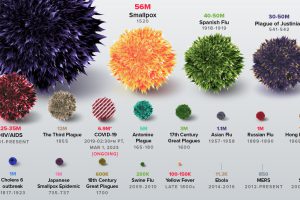
The history of pandemics, from the Antonine Plague to the novel coronavirus (COVID-19) event, ranked by their impact on human life. Read more


