


From Patagonia to TikTok, which brands are highly regarded in the eyes of Americans? This visual ranks the brand reputations of 100 companies. Read more
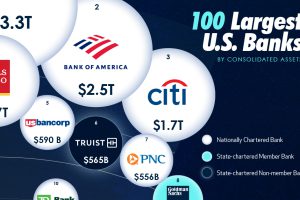
In this visual we showcase the relative size of the 100 largest U.S. banks in terms of consolidated assets. Read more
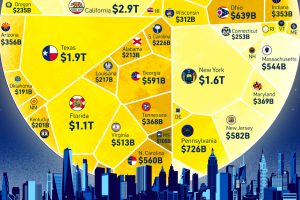
How does each state contribute to America’s overall GDP? This visualization breaks down the U.S. economy by state. Read more
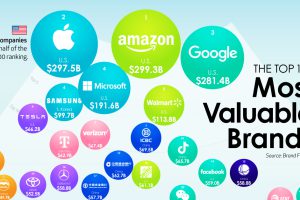
We show the top companies by brand value—and the brands that are rising the fastest as consumer expectations shift. Read more
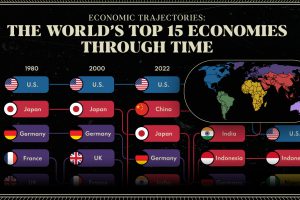
We provide a historical and predictive overview of the top economies in the world, including projections all the way to 2075. Read more

How much does each country contribute to the $105 trillion world economy in 2023, and what nations are seeing their nominal GDPs shrink? Read more
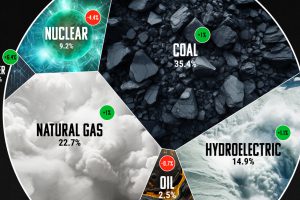
Coal still leads the charge when it comes to electricity, representing 35% of global power generation. Read more
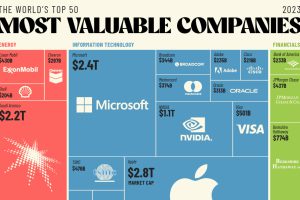
The world’s 50 most valuable companies represent over $25 trillion in market cap. We break this massive figure down by company and sector. Read more

This map explainer looks at the Gaza Strip from a structural point of view, delving into geography, infrastructure, demographics, and more. Read more
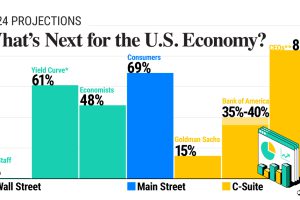
In this graphic, we show the probability of a U.S. recession in 2024, based on forecasts from Wall Street, Main Street, and the C-Suite. Read more