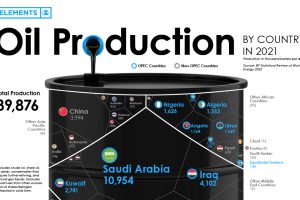
Global oil production averaged 89.8 million barrels of oil per day in 2021. Here are the world’s largest oil producers. Read more
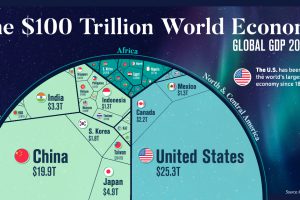
Despite ripple effects from conflict and inflation, global growth continues. According to the IMF, the global GDP will hit $104 trillion by end of year. Read more
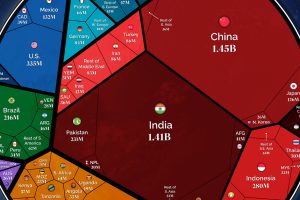
Our population will soon reach a new milestone—8 billion. These visualizations show where all those people are distributed around the world Read more
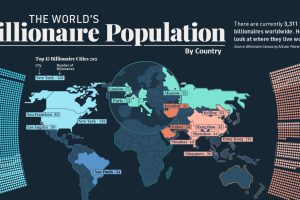
Collectively, worldwide billionaire wealth is nearly $12 trillion. This map breaks down where these 3,311 billionaires live around the globe. Read more
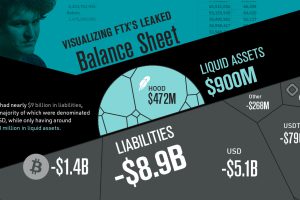
As Sam Bankman-Fried’s crypto exchange FTX files for bankruptcy, this graphic visualizes FTX’s balance sheet leaked by the Financial Times. Read more

This month, along with regularly scheduled features, our special dispatches break down the IEA’s latest report and the state of the markets. Read more
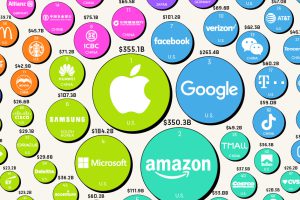
A strong brand is extremely lucrative when leveraged properly. Here’s a look at the most valuable brands in 2022, according to Brand Finance. Read more
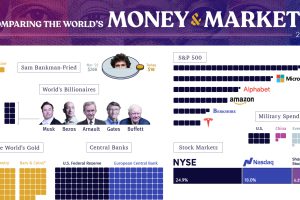
From the wealth held to billionaires to all debt in the global financial system, we look at the vast universe of money and markets in 2022. Read more


