
Give yourself a head start into 2022. Join VC+ to gain exclusive access to our premium Prediction Consensus content. Read more
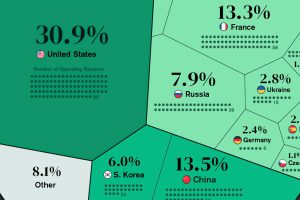
Nuclear power accounted for 10% of global electricity generated in 2020. Here’s a look at the largest nuclear power producers. Read more
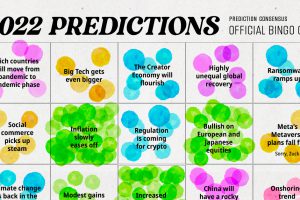
We analyzed 300+ articles, reports, and interviews to answer the question: is there any consensus on 2022 predictions? Here are the results. Read more
In this eighth edition of our yearly round-up, we highlight visualizations that broke new ground in design and data-driven reporting. Read more
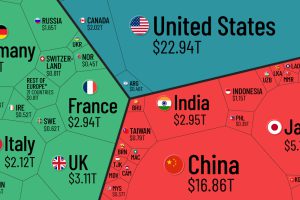
Which countries and regions contribute the most to the world economy? In this infographic, we break down all $94 trillion of global GDP by country. Read more

Global debt reached $226T by the end of 2020 – the biggest one-year jump since WWII. This graphic compares the debt-to-GDP ratio of various countries. Read more
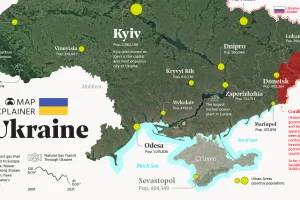
Ukraine has made the headlines due to the ongoing tensions with Russia. In this map infographic, we examine Ukraine from a structural point of view. Read more

What goes on in the mind of Elon Musk, the world’s richest person? We analyzed over 15,000 of his tweets to find out. Read more

Now, you can explore even more data-driven visualizations from the global talent in our newly launched Creator Program. Read more
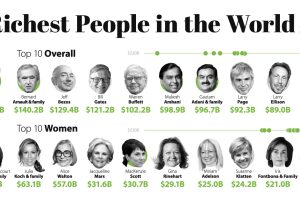
Elon Musk. MacKenzie Bezos. Zhang Yiming. This infographic is a snapshot of the richest people in the world during this turbulent time. Read more

