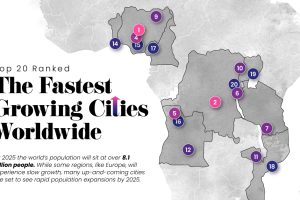
Nearly 60% of the world’s population lives in cities and this trend is not slowing down—take a look at the world’s 20 fastest growing cities. Read more
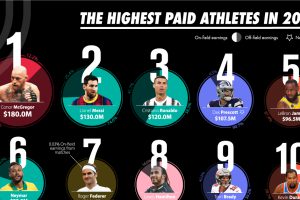
Athletes pull huge sums of money from their on-field and off-field contracts. Here we rank the top 50 highest-paid athletes in the world. Read more
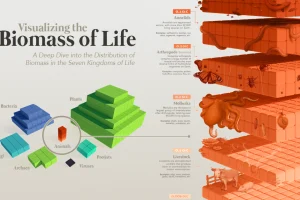
Our planet supports nearly 8.7 million species. We break down the total composition of the living world in terms of its biomass. Read more
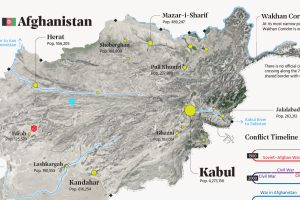
This map explainer looks at Afghanistan from a structural point of view, delving into geography and population patterns. Read more
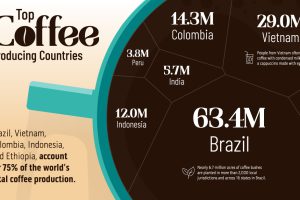
Coffee is the third most consumed beverage globally. Here we visualize the countries that have the highest coffee production in the world. Read more

This timeline visualization is a high-level record of what happened on the fateful morning of September 11, 2001 Read more
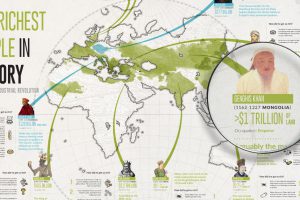
What do Augustus Caesar, Cosimo de Medici, Mansa Musa, and Genghis Khan have in common? They were some of the richest people in all of history. Read more

The amount of human-made (or anthropogenic) mass, has now exceeded the weight of all life on Earth, including humans, animals, and plants. Read more
We’ve doubled down on what makes VC+ great. See free samples while perusing what we have in store for the rest of November. Read more
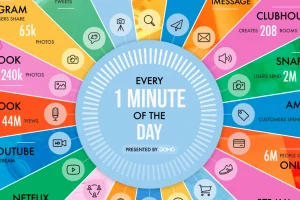
A lot can happen in an internet minute. This stat-heavy graphic looks at the epic numbers behind the online services billions use every day. Read more

