
This animation provides an interesting overview of the websites with the highest traffic over the last few decades, and how the rankings have changed. Read more

Nearly half the world has tapped into the social media universe. Monthly Active Users (MAUs) quantifies the success of these giant platforms. Read more

A lot can happen in an internet minute. This graphic looks at the enormous numbers behind the online services billions use every day. Read more

By embracing uncertainty and making timely pivots, we visualize the bizarre origin stories of the most successful tech companies today. Read more

Billion-dollar IPOs are always exciting, but how do modern raises compare to the world’s largest IPOs throughout history? We chart the top 25. Read more
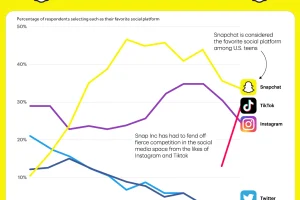
In today’s competitive social media landscape, Snapchat is #1 with American teens, but TikTok is quickly closing the gap. Read more
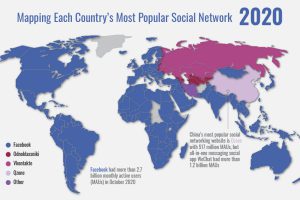
Mapping the rapid expansion of Facebook into the world’s dominant social network, and the countries and platforms resisting its growth Read more
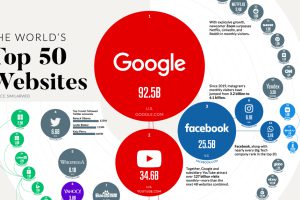
Just three websites get 152 billion visits monthly, outpacing the rest of the internet. Here, we rank the most visited websites worldwide. Read more

Big Tech just keeps on getting bigger. How much do the FAATMAN companies generate in revenues per minute? Read more
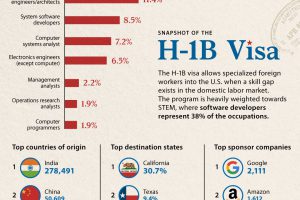
This infographic covers all the key charts and data for the H1-B visa, which grants foreign skilled workers employment in the U.S. Read more

