

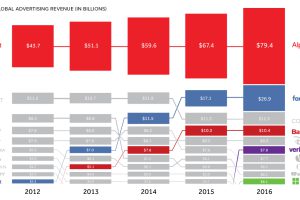
Traditional media is having a tough time keeping up, as Google, Facebook, and Chinese search giant Baidu lead the tech takeover of advertising. Read more
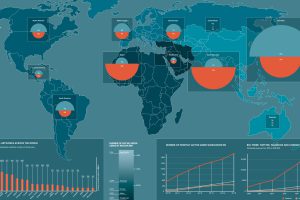
How representative is social media of actual regional geographic populations? This map compares both numbers side by side with interesting results. Read more
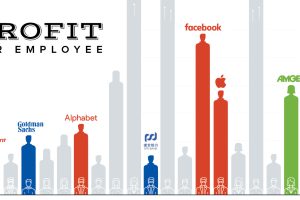
Which company rakes in the most profit per employee? Today’s chart looks at the top 20 global companies by that measure, including two unexpected leaders. Read more
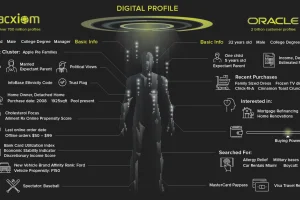
Though Facebook has been in the spotlight, it’s only one part of a complex, multi-billion dollar industry that makes a living from your personal data. Read more
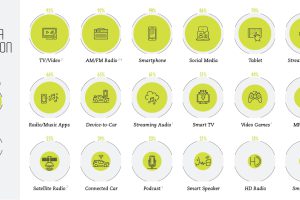
Americans spend an astonishing 12 hours per day consuming different types of media. Here are which media technologies are the most ubiquitous. Read more
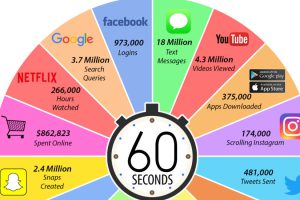
Not much happens in a minute of everyday life – but on the internet, it’s a different story! See the web’s scale visualized with this internet minute chart. Read more
See what types of companies are getting gobbled up by Amazon, Facebook, Google, and other tech majors on this interactive tech acquisition chart. Read more
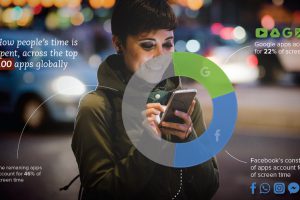
Facebook and Google owned apps capture 54% of all app screen time, out of the top 100 most popular apps around the world. Read more
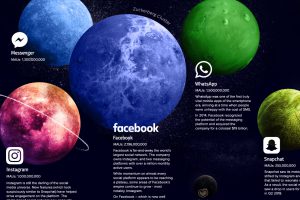
Explore the social media universe in this giant infographic, where every platform is a planet sized based on the amount of users it has. Read more
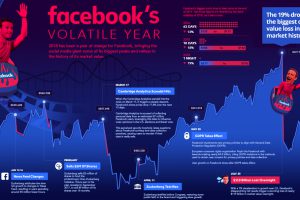
From privacy scandals to falling user engagement, it’s been a wild ride for Facebook in 2018. We recap Facebook’s volatile year in this massive chart. Read more