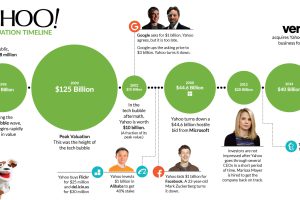
The roller coaster for Yahoo finally ends. This timeline shows where Yahoo execs went wrong during the company’s 20 year history. Read more
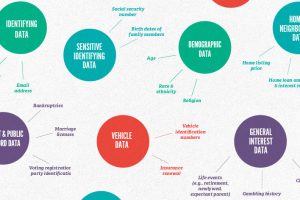
Services like Google and Facebook may seem free, but they actually come at a cost: your personal data. Find out what it’s worth to marketers and brokers. Read more
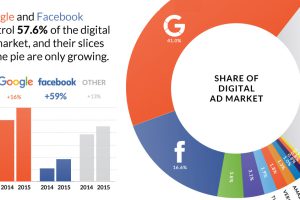
Nearly $0.60 of every $1.00 spent on digital advertising goes to Google and Facebook. Read more

Social media isn’t solely to blame for so-called fake news. The rapid decline in the trust of mass media and other institutions are factors as well. Read more
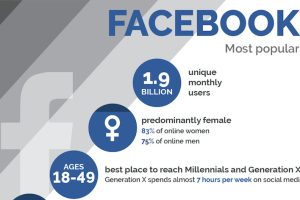
The social networks are all different, and smart businesses are tailoring their messaging based on the fundamental demographic differences between them. Read more

Here are the technologies that Facebook is working on to try and transform the company into a $1 trillion behemoth over the next 10 years. Read more
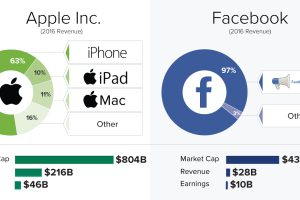
These five companies combined for $555 billion in revenues in 2016 – here’s a breakdown of each company’s revenue by product or service category. Read more
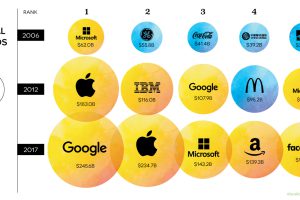
Tech titans like Google and Apple now dominate the list of the most valuable brands in the world. See how much all of these brands are worth in this chart. Read more
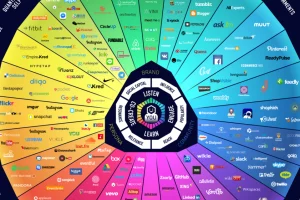
Explore the massive social media ecosystem of 2017 with this infographic, as well as how things have changed over the last 10 years. Read more
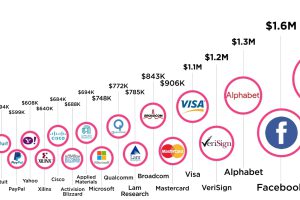
Here’s how much tech companies make per person on staff – Apple, Facebook, and Alphabet all make well over $1 million in revenue per employee. Read more

