
A breakdown of which factors that comprise economic complexity, and which global economies rank the highest. Read more
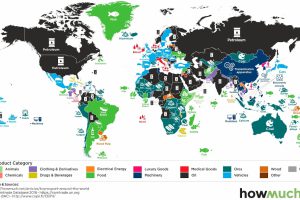
What is the top export in every country? This series of maps explores some of the most influential goods in global trade. Read more
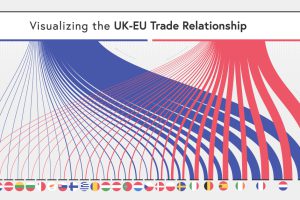
The UK and the EU have recently laid out new terms for their relationship. So how important is the UK’s trade with the EU? Read more
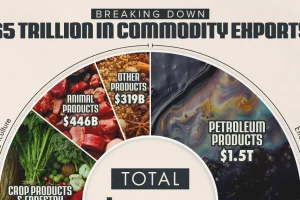
The energy sector accounts for 40% of the value of global commodity exports. And there’s a key product within it that dominates international trade. Read more
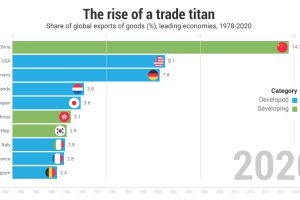
China’s economy today is completely different than 40 years ago; in 2021 the country makes up the highest share of exports globally. Read more

The world’s biggest pharmaceutical companies are worth $4.1 trillion. Here we map the top 100 companies based on their market cap value. Read more

This graphic visualizes Ukraine’s top international trading partners and the country’s most exported and imported products in 2020. Read more

China’s lockdown of Shanghai is causing massive back-ups at the world’s largest container port. Hundreds of ships are now waiting at sea. Read more
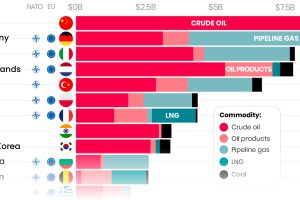
Here are the top importers of Russian fossil fuels since the start of the war. Read more
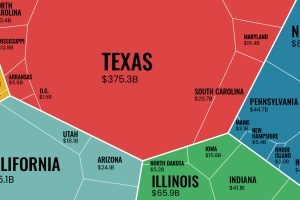
The U.S. exported $1.8 trillion worth of goods in 2021. This infographic looks at where that trade activity took place across the nation. Read more

