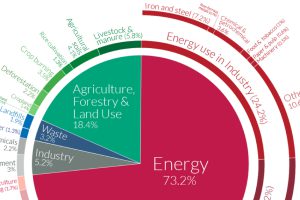
World emissions have reached almost 50 billion tonnes of greenhouse gases (GHGs) and counting. Which major sectors do they originate from? Read more

This graphic displays the number of registered electric vehicles (EVs) per 100,000 people in each state as of June 2024. Read more
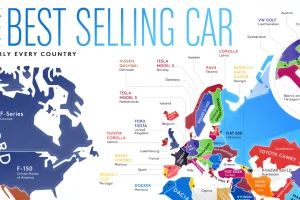
From American trucks to European sedans, this map shows the best-selling vehicles in the world. Read more
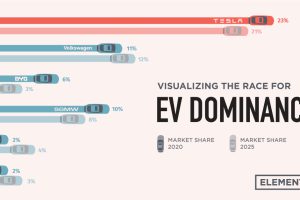
Tesla was the first automaker to hit a $1 trillion market cap, but other electric car companies have plans to unseat the dominant EV maker. Read more
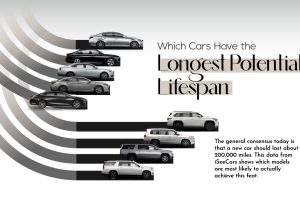
Japanese automakers like Toyota are known to produce some of the longest lasting cars in the world, but does the data support this claim? Read more

See how 14 major automakers have adopted various fuel-saving technologies in this infographic based on EPA data. Read more
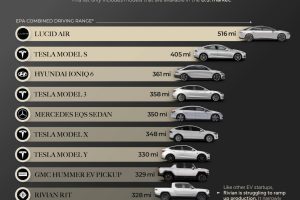
This infographic lists 10 of the longest range EVs currently for sale in the U.S. in 2023. The Lucid Air takes first place at 516 miles. Read more
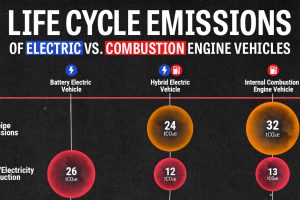
We look at carbon emissions of electric, hybrid, and combustion engine vehicles through an analysis of their life cycle emissions. Read more


