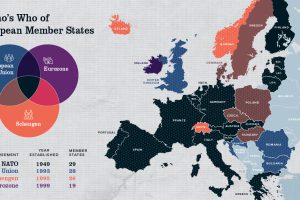
Europe has members in at least four major treaty groups. This map shows how these groups fit into the big picture of Europe’s member states. Read more
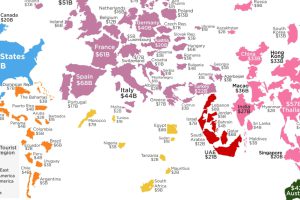
How much do your vacations contribute to your destination of choice? This visualization shows the countries that receive the most tourist spending. Read more
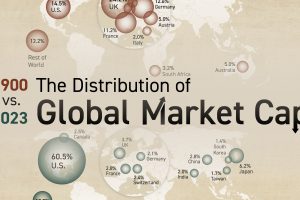
We breakdown the world’s largest stock markets by country, highlighting the massive growth of the U.S. and Asia. Read more
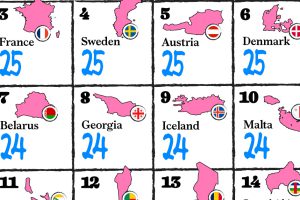
All EU member states are required by law to ensure a minimum of 20 days (four weeks) of paid time off in their labor codes. Read more
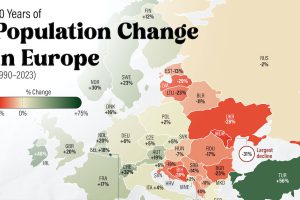
There’s an east-west divide when it comes to Europe’s population growth in the last 30 years. And it’s very apparent in this map. Read more

There’s only one country with a skyscraper count in the four digits. Here’s the top 12 with the most skyscrapers. Read more
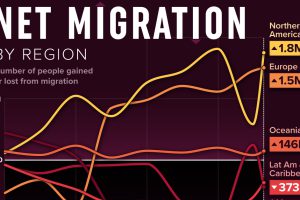
We visualized net migration statistics from the United Nations to gain insight into the flow of people globally. Read more
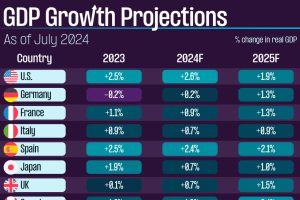
We summarize the latest GDP growth projections from the IMF, covering select economies from the developed and developing world. Read more
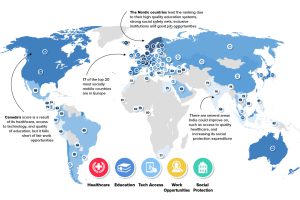
Ranked: The Social Mobility of 82 Countries It’s an unfortunate truth that a person’s opportunities can be partially tethered to their socioeconomic status at birth. Although winning or losing the… Read more
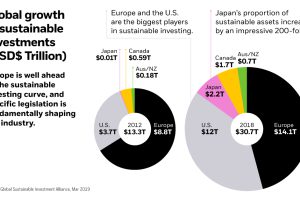
Total assets in sustainable investing reached nearly $31 trillion in 2018. What are the driving forces behind the global rise of sustainable investing? Read more

