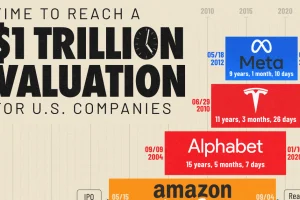
Berkshire Joins the $1 Trillion Club: How Long Did It Take?

See how it long it took America’s most valuable companies, including Berkshire Hathaway, to reach a $1 trillion valuation in this graphic. Read more

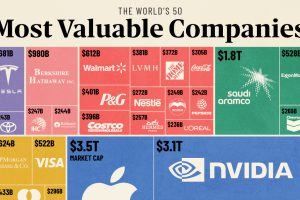
Ranked: The 50 Most Valuable Companies in the World in 2024

See a breakdown of the world’s 50 most valuable companies, which represent $34 trillion in combined market capitalization. Read more

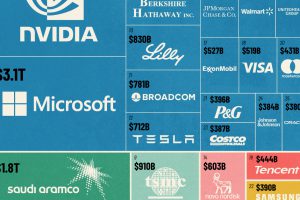
Visualizing the World’s Top 25 Companies by Market Cap

We combined the world’s top 25 companies by market cap into a single chart, based on August 2024 prices. Read more

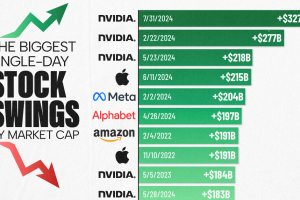
Ranking the Biggest Single-Day Stock Swings of All Time

One company dominates this ranking of the biggest single-day stock swings in U.S. history. Read more

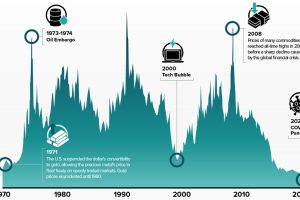
Charted: Commodities vs Equity Valuations (1970–2023)

The commodities-to-equities ratio recently hit a 50-year low. In the past, when this ratio reached such levels, commodity supercycles began. Read more

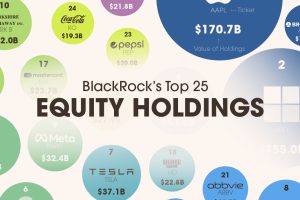
Visualizing BlackRock’s Top Equity Holdings

BlackRock is the world’s largest asset manager, with over $9 trillion in holdings. Here are the company’s top equity holdings. Read more
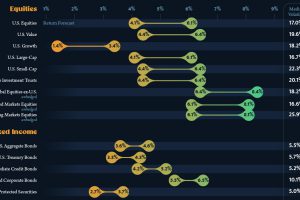
10-Year Annualized Forecasts for Major Asset Classes

This infographic visualizes 10-year annualized forecasts for both equities and fixed income using data from Vanguard. Read more
Will Tesla Lose Its Spot in the Magnificent Seven?

We visualize the recent performance of the Magnificent Seven stocks, uncovering a clear divergence between the group’s top and bottom names. Read more

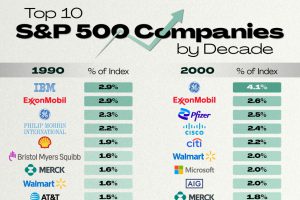
How the Top S&P 500 Companies Have Changed Over Time

We look at the top S&P 500 companies since 1990 to highlight how the American economy has evolved over time. Read more

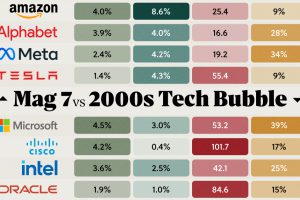
Stock Comparison: Magnificent 7 vs. 2000s Tech Bubble

We visualized key stock metrics to see how the Magnificent 7 compares to seven of the top stocks from the 2000s tech bubble. Read more