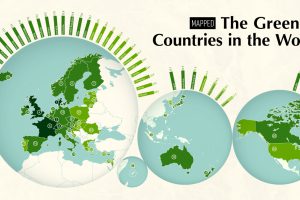
The world’s growing focus on sustainability is a clear sign of the times. This map ranks the 40 greenest countries in the world. Read more
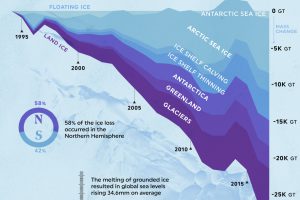
In just over two decades, the planet has seen 28 trillion tonnes in global ice loss. 58% of this ice loss occurred in the Northern Hemisphere. Read more
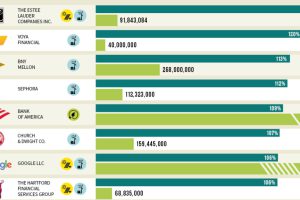
Which U.S. companies use the most green energy as a percentage of total energy used? Here are the 50 highest ranked companies according to the EPA. Read more
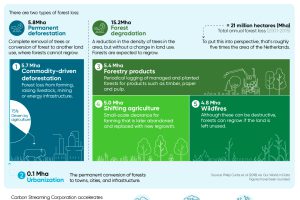
Approximately 15 billion trees are cut down annually across the world. Here’s a look at the five major drivers of forest loss. (Sponsored) Read more
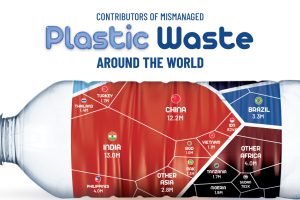
About 22% of the world’s annual plastic waste generation is mismanaged. Here’s a break down of mismanaged plastic waste by country. Read more

As the market for low-emission solutions expands, China dominates the production of clean energy technologies and their components. Read more
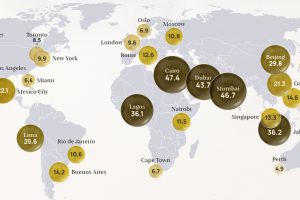
Exploring 2022 average air pollution levels around the world by PM2.5 concentration. Read more

Which foods are linked with high CO2 emissions and high water use? We look at the environmental impacts of food production in this chart. Read more


