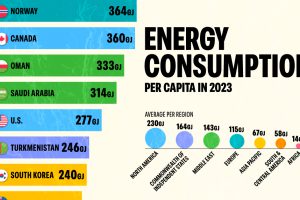
In 2023, the world consumed 2% more energy compared to 2022. Which countries consumed the most energy per capita? Read more
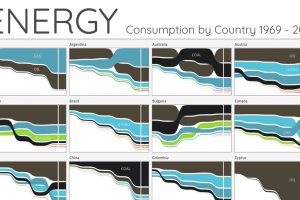
For the last 50 years, fossil fuels have dominated energy consumption. This chart looks at how the energy mix is changing in over 60+ countries. Read more
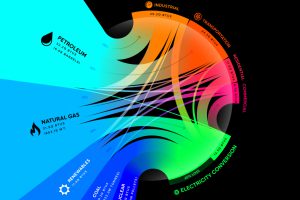
From renewables to fossil fuels, we’ve visualized the diverse mix of energy sources that powered U.S. energy consumption in 2020. Read more
Which U.S. companies use the most green energy as a percentage of total energy used? Here are the 50 highest ranked companies according to the EPA. Read more
Global consumption of coal surpassed 8 billion tonnes per year for the first time in 2022. Here are the countries using the most coal. Read more


