

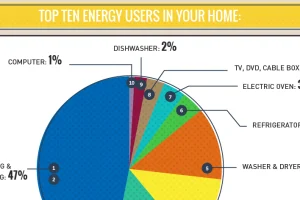
The average U.S. household spends $1,368 per year on energy, and a whopping 35% of that is wasted by appliances. See what uses the most energy in your home. Read more
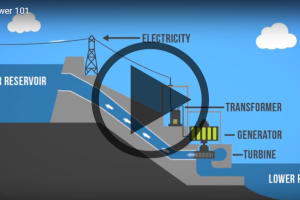
Want to learn about how different energy sources work? Check out these short, fact-driven videos on topics like oil, hydro, solar, wind, LNG, or fracking. Read more
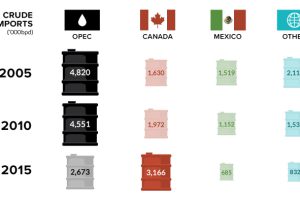
Canada is in, and OPEC is out. In this week’s chart on oil imports, we also look at the declining influence of the world’s most infamous oil cartel. Read more
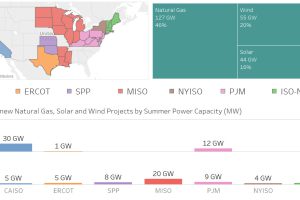
Nearly 100 GW of new power coming online is from solar and wind, making up 36% of new electrical capacity being added in these jurisdictions. Read more
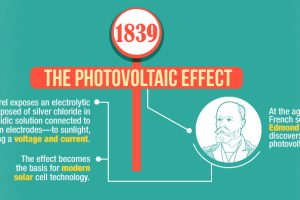
This infographic shows the many technological advances made throughout the history of solar energy – going all the way back to the Neolithic Era in China. Read more
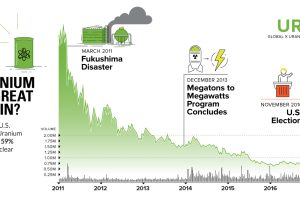
Uranium was the most hated commodity for the last 6 years – but things are changing. Trump could be a boon to the metal, with miners up 59% since election… Read more
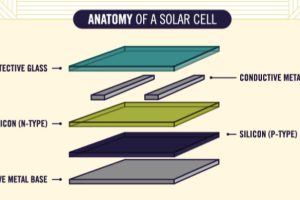
Ever wonder how solar panels work to generate electricity? This animated infographic explains the science behind it, making it easy to understand for anyone. Read more
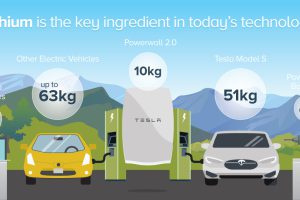
How is lithium-ion powered battery technology fueling the green revolution? See how much of the metal is in various everyday devices in this infographic. Read more

In a remote part of eastern Russia, the world’s deepest oil well has been drilled to incredible depths – potentially unlocking a shelf of 2.3 billion barrels. Read more
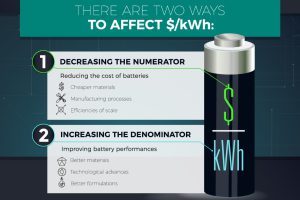
What’s the best way to reduce the $/kWh of li-ion batteries? Historically, it’s by advances in the cathode, and that may be the case for the future as well. Read more