

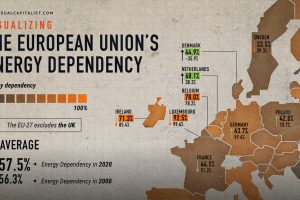
The EU’s energy dependency has become a major issue amid Russia’s invasion of Ukraine. See what the data says in this infographic. Read more
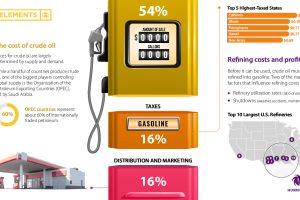
Gasoline prices across the U.S. have reached record-highs. Why? This graphic helps explain what factors influence the cost of gasoline. Read more
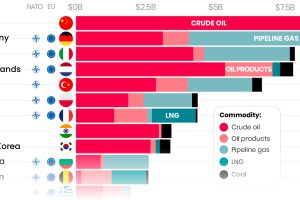
Here are the top importers of Russian fossil fuels since the start of the war. Read more
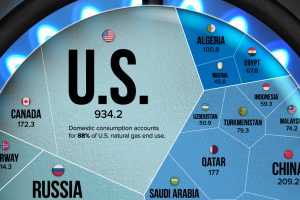
Natural gas prices have risen since Russia’s invasion of Ukraine. This visualization highlights the world’s largest natural gas producers. Read more
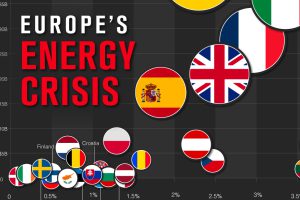
As European gas prices soar, countries are introducing policies to try and curb the energy crisis. Read more

The supply chain is key for the renewable energy revolution, and this chart visualizes where the world’s solar panels are manufactured. Read more

How much oil, coal, and natural gas do we extract each year? See the scale of annual fossil fuel production in perspective. Read more
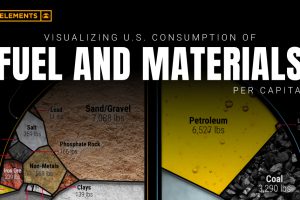
Wealthy countries consume large amounts of natural resources per capita, and the U.S. is no exception. See how much is used per person. Read more
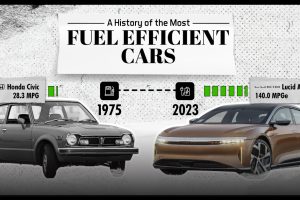
This infographic lists the most fuel efficient cars over the past 46 years, including the current leader for 2023. Read more
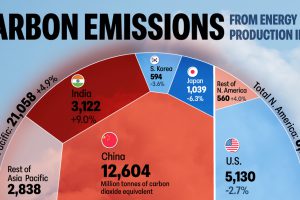
The energy sector is the main contributor of greenhouse gas emissions globally. Which countries’ energy sector emits the most CO2? Read more