

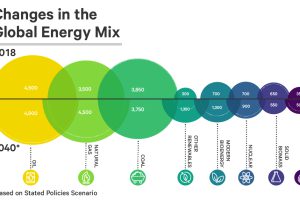
See how the world’s future energy mix is expected to change by 2040, using projections based on two different policy scenarios. Read more
Which countries are turning to nuclear energy, and which are turning away? Mapping and breaking down the world’s nuclear reactor landscape. Read more
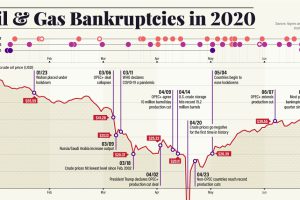
Dropping crude prices and a worsening pandemic have led to a growing wave of energy bankruptcies. Here’s what that fallout looks like. Read more
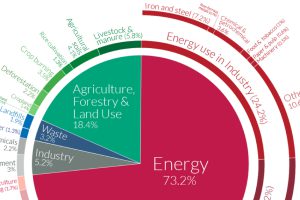
World emissions have reached almost 50 billion tonnes of greenhouse gases (GHGs) and counting. Which major sectors do they originate from? Read more
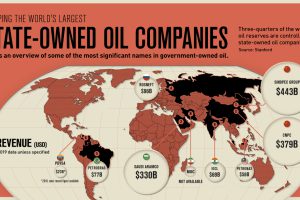
State-owned oil companies control roughly three-quarters of global oil supply. See how these companies compare in this infographic. Read more
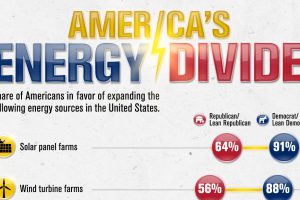
Out of all energy sources, nuclear energy has the smallest partisan gap between Democrats and Republicans. Read more
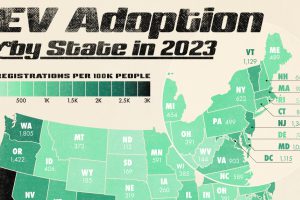
This graphic displays the number of registered electric vehicles (EVs) per 100,000 people in each state as of June 2024. Read more
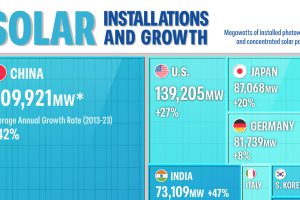
The Asia-Pacific region is leading the solar energy transition as of 2023. Which countries are building the most solar power? Read more
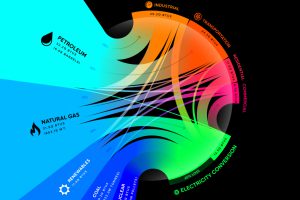
From renewables to fossil fuels, we’ve visualized the diverse mix of energy sources that powered U.S. energy consumption in 2020. Read more
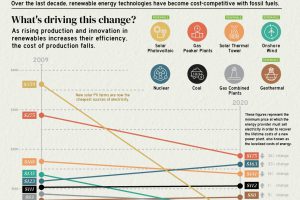
The cost of electricity from solar PV plants has decreased by 90% since 2009, highlighting the rapidly changing economics of electricity production. Read more