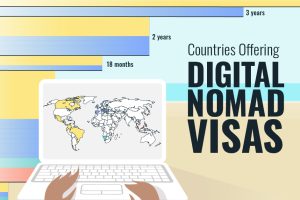
Mexico and El Salvador offer the longest visa for digital nomads. Read more
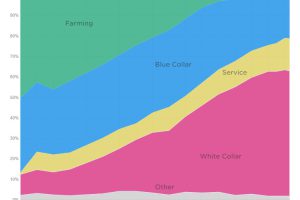
These graphics show how machines have destroyed jobs over time – but also how they create new ones in the process. Read more
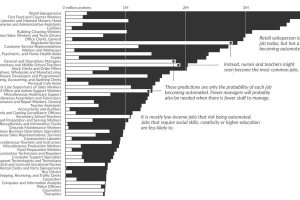
What types of jobs will be lost to automation? This data visualization applies probabilities from a well-cited study to current U.S. job numbers. Read more
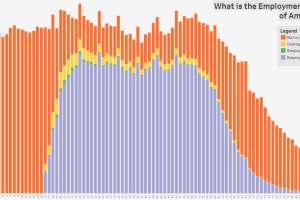
These three charts show the age distribution of the U.S. population, further broken down by employment status, education, and marital status. Read more

Walmart employs 1.5 million people across the country – and the retail behemoth is now the largest private employer in 22 states. Read more
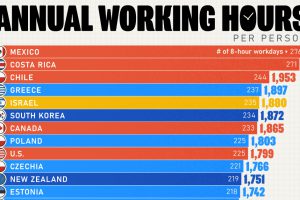
We rank OECD countries by their average working hours per year, revealing some interesting regional trends. Read more
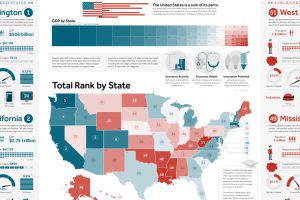
This giant infographic has state economies ranked from best to worst, based on an overall score comprised of 27 different metrics. Read more
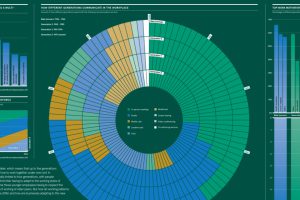
Summing up the differences in how generations approach work, including on topics such as communication, motivation, and employer loyalty. Read more
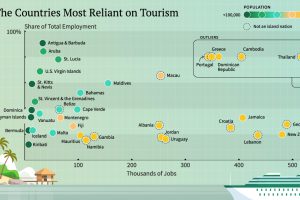
With international travel grinding to a halt, here are the economies that have the most to lose from a lack of tourism. Read more
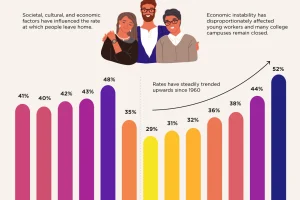
Today 52% of young adults aged 18-29 live with their parents. Economic and societal factors have played a part in addition to the COVID-19. Read more

