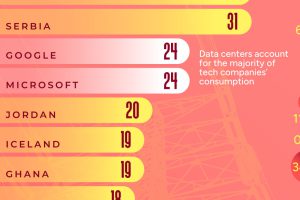
Microsoft aimed for carbon neutrality by 2030. Now its electricity use and carbon emissions are on the rise. Read more
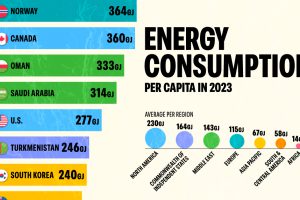
In 2023, the world consumed 2% more energy compared to 2022. Which countries consumed the most energy per capita? Read more
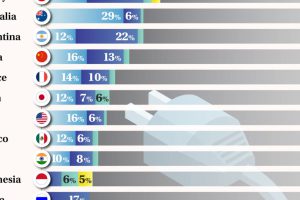
Brazil leads the G20 in renewable electricity. Read more
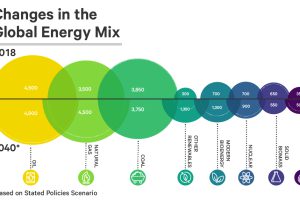
See how the world’s future energy mix is expected to change by 2040, using projections based on two different policy scenarios. Read more
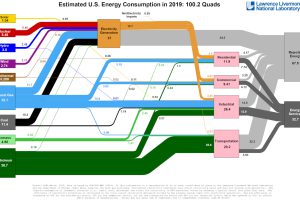
This incredible flow diagram shows how U.S. energy use broke down in 2019, including by source and end sector. Read more

Bitcoin mining requires significant amounts of energy, but what does this consumption look like when compared to countries and companies? Read more
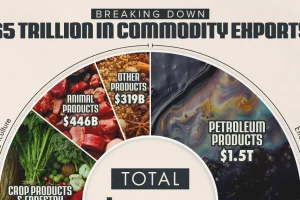
The energy sector accounts for 40% of the value of global commodity exports. And there’s a key product within it that dominates international trade. Read more
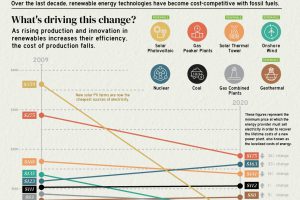
The cost of electricity from solar PV plants has decreased by 90% since 2009, highlighting the rapidly changing economics of electricity production. Read more
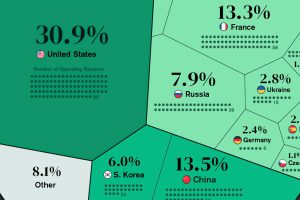
Nuclear power accounted for 10% of global electricity generated in 2020. Here’s a look at the largest nuclear power producers. Read more


