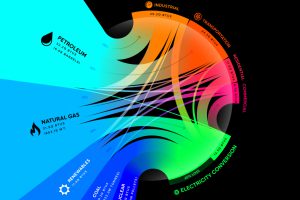
From renewables to fossil fuels, we’ve visualized the diverse mix of energy sources that powered U.S. energy consumption in 2020. Read more

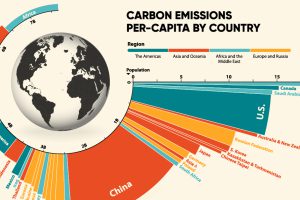
33.6 Gt of CO2 was emitted across the world in 2019. Here we visualize the global per capita CO2 emissions by country and region. Read more

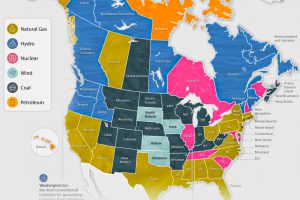
The U.S. and Canada rely on a different makeup of sources to generate their electricity. How does each state and province make theirs? Read more

