The Growth in Residential Solar Energy The popular myth persists that the cost of green energy is simply not economic. While it is true that this may have been the… Read more

In this Powering New York slideshow, we visualize what it takes to power NYC with every type of energy including gas, wind, solar, nuclear, and more. Read more
With supply remaining abundant and demand staying weak, the debate continues on when Peak Coal will occur in China. This infographic looks at growth and energy trends in coastal vs.… Read more
See in this .gif animation how much the U.S. electricity grid has evolved over the last two decades. Read more
How does electricity to your home? This infographic shows how the power grid works, along with the brand new innovations coming to a grid near you. Read more
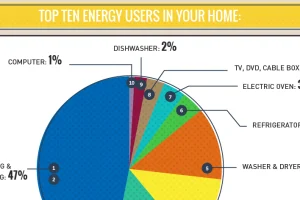
The average U.S. household spends $1,368 per year on energy, and a whopping 35% of that is wasted by appliances. See what uses the most energy in your home. Read more
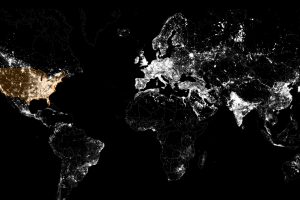
These satellite maps visualize where different energy sources, like fossil fuels, nuclear, or renewables, are used to generate electricity. Read more
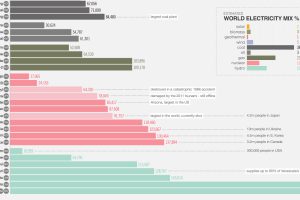
As global population grows, our energy demand grows as well. Here are the largest energy sources in the world and how much electricity they generate. Read more


