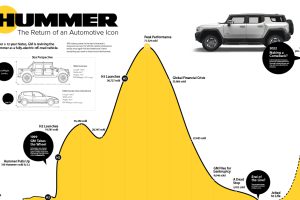
GM has received over 65,000 preorders for its upcoming Hummer EV. See how this compares to the brand’s previous sales in one infographic. Read more
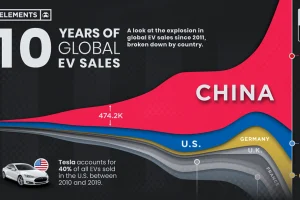
Global EV sales have grown exponentially, more than doubling in 2021 to 6.8 million units. Here’s a look at EV sales by country since 2011. Read more
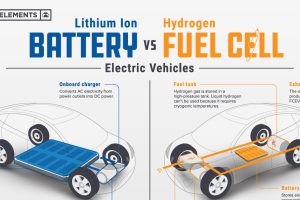
Understand the science behind hydrogen fuel cell vehicles, and how they differ from traditional EVs. Read more
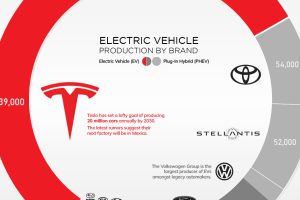
Tesla is still the dominant player in electric vehicles. However, it may not be long until the rest of the industry catches up. Read more
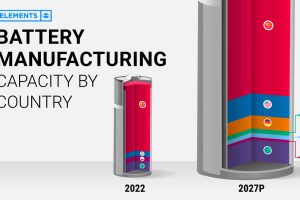
This infographic breaks down battery manufacturing capacity by country in 2022 and 2027. Read more
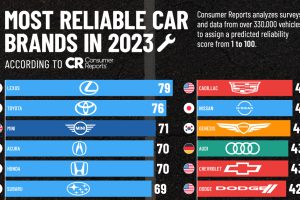
Consumer Reports ranked the most reliable car brands using surveys and analysis of over 330,000 vehicles. Which cars are most reliable? Read more

With EVs becoming more popular around the world, have combustion vehicles reached a peak? Find out in this infographic. Read more
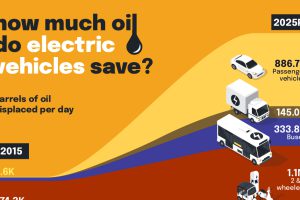
How much oil is saved by adding electric vehicles into the mix? We look at data from 2015 to 2025P for different types of EVs. Read more
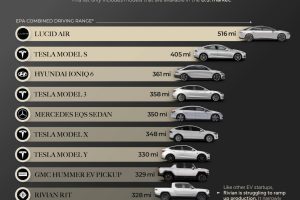
This infographic lists 10 of the longest range EVs currently for sale in the U.S. in 2023. The Lucid Air takes first place at 516 miles. Read more


