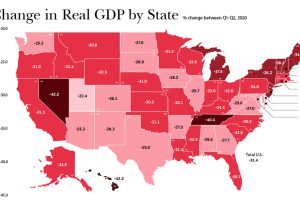
In just a few months, the U.S. economy reeled from COVID-19. As real change in GDP suffered, which states and industries were the hardest-hit? Read more

Podcasting is now a billion dollar industry, attracting big names and audiences to match. Here’s a global look at the top podcasts on Spotify. Read more
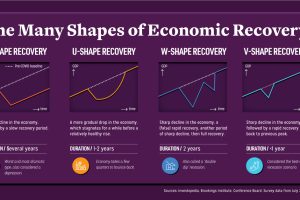
Economic recovery from COVID-19 could come in four shapes—L, U, W, and V. What do they mean, and what do global CEOs see as the most likely? Read more

A lot can happen in an internet minute. This graphic looks at the enormous numbers behind the online services billions use every day. Read more
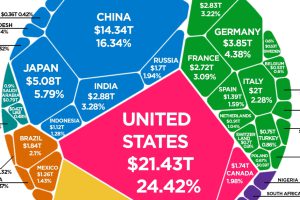
The world’s total GDP crested $88 trillion in 2019—but how are the current COVID-19 economic contractions affecting its future outlook? Read more
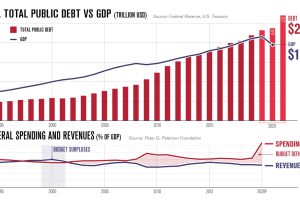
America’s debt recently surpassed $27 trillion. In this infographic, we peel back the layers to understand why it keeps on growing. Read more
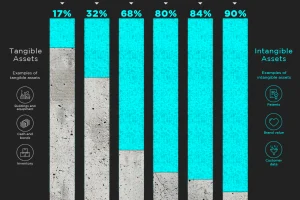
Intangible assets have increased as a portion of total assets in the S&P 500 for 45 years. Today they represent 90% of all assets. Read more
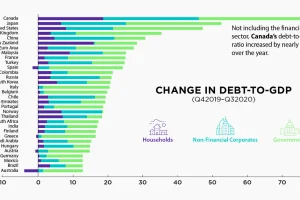
The battle against the COVID-19 pandemic has resulted in heightened debt-to-GDP levels across all sectors and countries. Read more
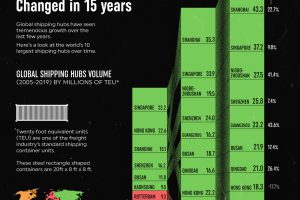
The largest shipping hubs have gotten bigger and busier. Here’s a look at how the global landscape has evolved over the past 15 years. Read more


