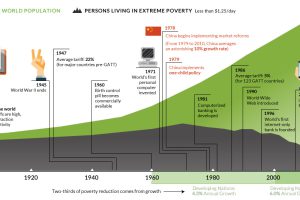
This interactive graphic shows the poverty rate of every state, and also how poverty levels have changed over time according to the U.S. Census Bureau. Read more
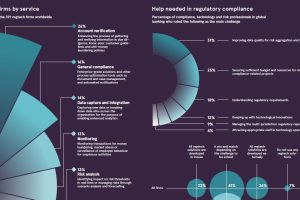
This infographic provides a glimpse into the world of regtech, a booming tech sector that’s helping financial firms to comply with onerous regulations. Read more
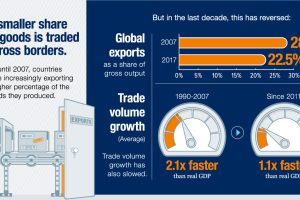
Evidence is growing that the nature of globalization is changing dramatically – and the countries, companies, and workers that benefit are changing as well. Read more
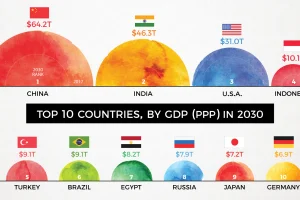
By 2030, the complexion of the global economy could look very different. This animation shows how the world’s biggest economies will change over time. Read more
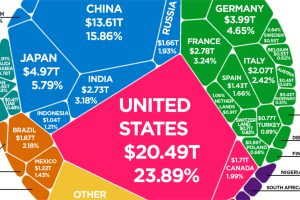
According to the latest World Bank data, the global economy is now $85.8 trillion in nominal terms. Here’s how it breaks down. Read more
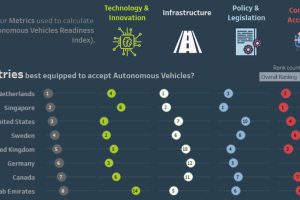
This interactive visual shows the countries best prepared for the shift to autonomous vehicles, as well as the associated societal and economic impacts. Read more
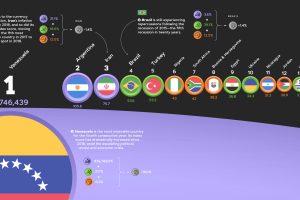
The annual Misery Index ranks the most and least miserable countries, based on four economic factors—unemployment, inflation, lending rates, and GDP growth. Read more
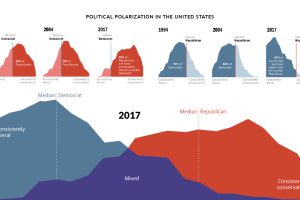
Since 1994, the political divide in the United States has only become more extreme. How have American feelings across major issues evolved over time? Read more
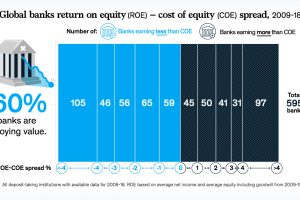
As we enter a late-cycle economy, a staggering 60% of banks are destroying value. Here’s the steps they can take in order to succeed. Read more


