

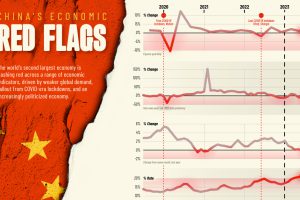
We chart six red flag indicators threatening China’s economy and it’s post-pandemic recovery, as well as global economic growth Read more
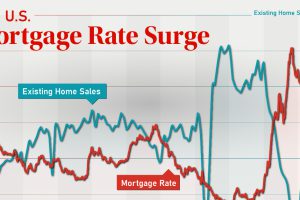
In this graphic, we take a look at the recent U.S. mortgage rate surge, and how the 30-year fixed-rate mortgage has evolved since 2013. Read more
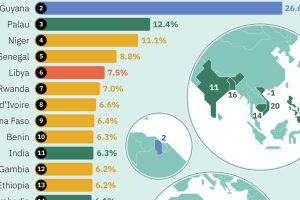
This graphic uses the latest IMF projections to rank the world’s top 20 fastest growing economies for 2024. Read more

The global middle class is expected to grow by 113 million people in 2024. We visualize this growth by country and region. Read more
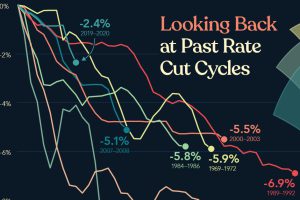
This visualization looks at how past interest rate cut cycles have gone and the rate cut forecasts by top institutions for 2024. Read more
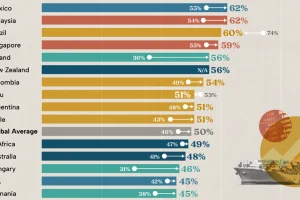
Will the global economy be stronger in 2024 than in 2023? Read more
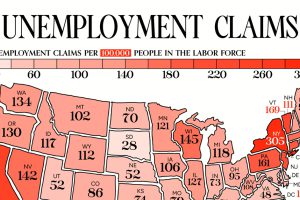
This visual heatmap of unemployment claims by state highlights New York, California, and Alaska leading the country by a wide margin. Read more
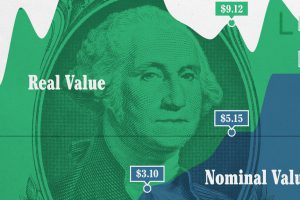
This graphic compares the nominal vs. inflation-adjusted value of the U.S. minimum wage, from 1940 to 2023. Read more
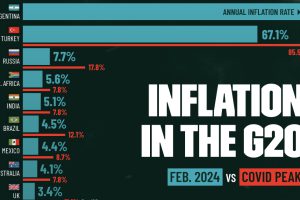
We visualize inflation rates across G20 countries as of Feb 2024, in the context of their COVID-19 pandemic peak. Read more
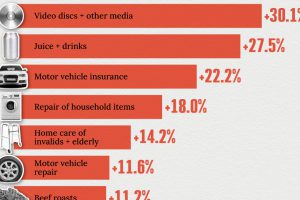
We visualized product categories that saw the highest % increase in price due to U.S. inflation as of March 2024. Read more