The U.S. and China were the top export markets for an equal number of G20 countries in 2022. But which countries were they? Read more
Florida’s economy ranked best in the nation for the second year. Read more
It takes Poland, Sweden, Austria, Norway, and 18 other countries together to match the might of Germany’s economy. Read more

About 46% of the American workforce, or 62 million people, are employed in a small business. Here’s the share breakdown by state. Read more
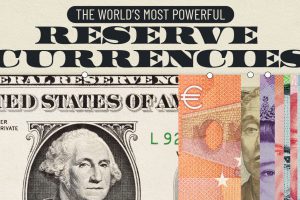
We breakdown $11.5 trillion in foreign exchange reserves to highlight the world’s top reserve currencies in 2024. Read more
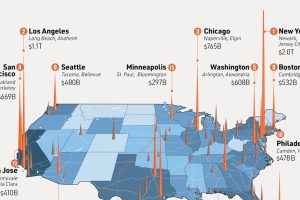
In this visual, we’ve ranked the top U.S. metropolitan areas in terms of their GDP. How does your city rank? Read more
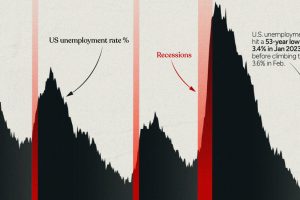
This infographic examines 50 years of data to highlight a clear visual trend: recessions are preceded by a cyclical low in unemployment. Read more
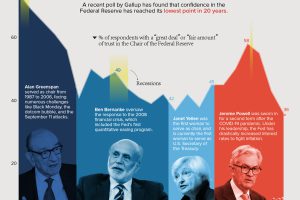
Public trust in the Federal Reserve chair has hit its lowest point in 20 years. Get the details in this infographic. Read more
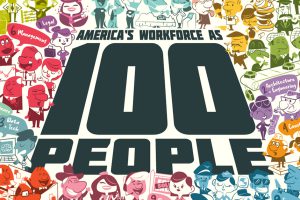
Reimagining all 200 million of the American workforce as 100 people: where do they all work, what positions they hold, and what jobs they do? Read more


