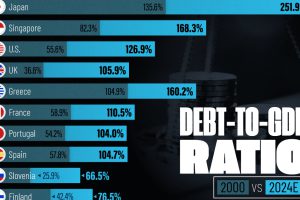
See how much the debt-to-GDP ratios of advanced economies have grown (or shrank) since the year 2000. Read more
Argentina tops the ranking, with a debt equivalent to 5.3% of the country’s GDP. Read more
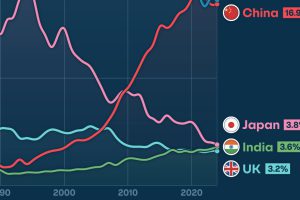
Gain a unique perspective on the world’s economic order from this graphic showing % share of global GDP over time. Read more

Asia’s exports span a wide range, from petroleum to technology components and textile products. Read more
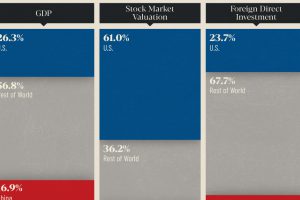
How do the world’s two largest economies compare? We look at the economies of U.S. and China across GDP, stock markets, and FDI. Read more

A single adult needs to make at least $116k annually to live comfortably in Massachusetts. Read more

By popular demand from our audience, we show how the U.S. is gradually becoming a cashless society. Read more
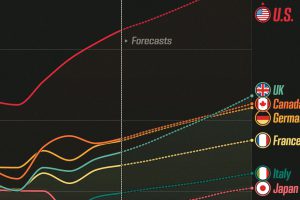
See how G7 economies are expected to perform in terms of GDP per capita, all the way to 2029. Read more
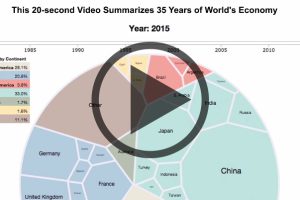
Watch the world economy evolve over 35 years in this video, which captures the breakdown of economic output by country. Read more


