
Since 2003, U.S. household debt has doubled to over $14.5 trillion. We break down the components of this colossal figure. Read more
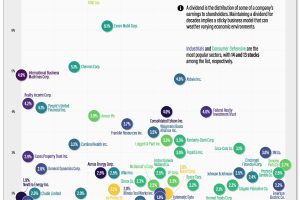
Dividend Aristocrats are stocks that have grown their dividend for at least 25 years. These stocks carry a stellar reputation in providing steady and predictable returns to shareholders Read more

Longer term serving CEOs are linked to superior stock price performance for the companies they oversee. Which CEOs are the longest serving today? Read more

Corporate finance oversees trillions of dollars and makes modern markets and economies possible, but who are the main players? Read more

Robust growth in mortgages has pushed U.S. consumer debt to nearly $16 trillion. Click to gain further insight into the situation. Read more

Stay up to date on the U.S. economy with this infographic summarizing the most recent Federal Reserve data released. Read more

Central bank digital currencies are coming, but progress varies greatly from country to country. View the infographic to learn more. Read more

We breakdown $11.5 trillion in foreign exchange reserves to highlight the world’s top reserve currencies in 2024. Read more

This infographic shows the net minimum wage across 67 countries, as of January 2023. A breakdown by U.S. state is also included. Read more
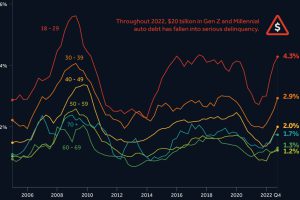
After a borrowing spree during COVID-19, younger Americans are struggling to keep up with their auto loan payments. Read more

