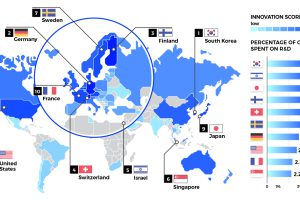
What countries have the most innovative economies? This index uses seven equally-weighted variables, including R&D spending and patents, to rank countries. Read more
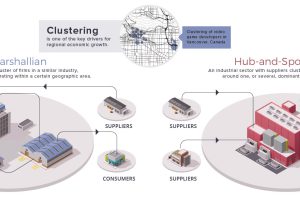
Economies create distinct spatial patterns. This week’s chart visualizes the relationships businesses and industry imprint on the urban environment. Read more
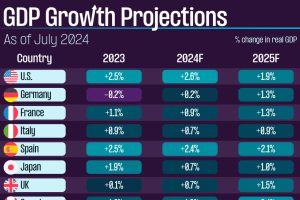
We summarize the latest GDP growth projections from the IMF, covering select economies from the developed and developing world. Read more
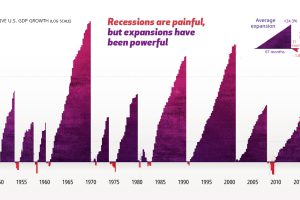
The economic cycle is a series of peaks and valleys. Analyzing economic data going back to 1950 helps put recessions into perspective. Read more
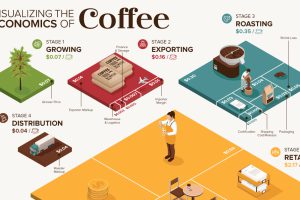
What makes your cup of coffee possible, and how much does it really cost? Here’s how the $200B coffee supply chain breaks down economically. Read more
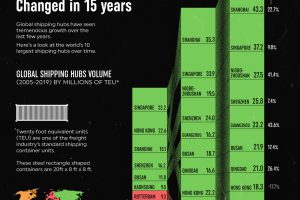
The largest shipping hubs have gotten bigger and busier. Here’s a look at how the global landscape has evolved over the past 15 years. Read more
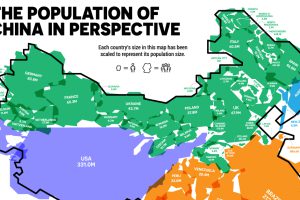
China is the world’s most populous country. But how does the population of China compare to the rest of the world? Read more
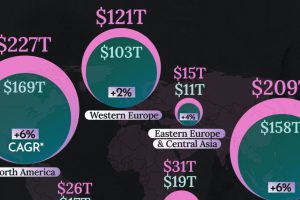
This graphic shows the latest forecasts for net wealth by region, highlighting the dominance of three key regions. Read more


