

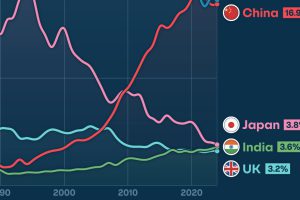
Gain a unique perspective on the world’s economic order from this graphic showing % share of global GDP over time. Read more
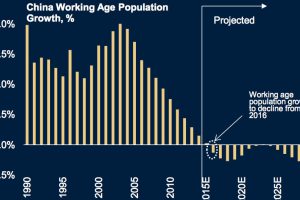
China has been at the forefront of economic growth for decades, but the Chinese growth engine is sputtering due to several factors including demographics. Read more
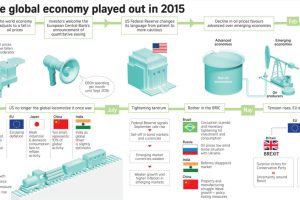
This infographic recaps economic events and sentiment in 2015. Should investors approach the new year with renewed optimism or brace for volatility? Read more

Today’s stunning map ranks the world’s most powerful megaregions — together, they contribute a whopping $28 trillion to the global economy. Read more
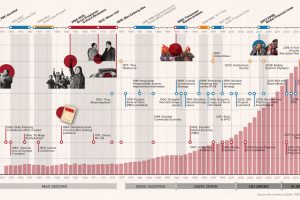
How did China go from agrarian economy to global superpower? This timeline covers the key events and policies that shaped the PRC over its 70-year history. Read more

In 2020, China will lift the restrictions on foreign ownership, creating a significant investment opportunity that cannot be ignored. Read more
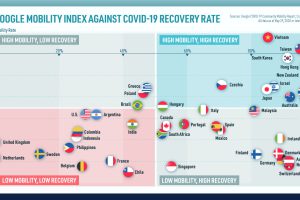
We look at mobility rates as well as COVID-19 recovery rates for 41 economies, to see which countries are reopening for business. Read more
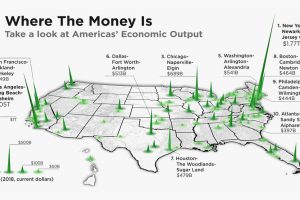
The total U.S. GDP stands at a whopping $21 trillion, but which metro areas contribute to the most in terms of economic output? Read more
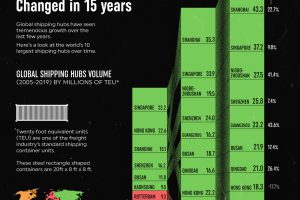
The largest shipping hubs have gotten bigger and busier. Here’s a look at how the global landscape has evolved over the past 15 years. Read more
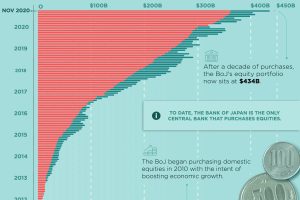
The Bank of Japan continues to be the only central bank that purchases equity securities, and it now holds $434 billion of Japanese stocks. Read more