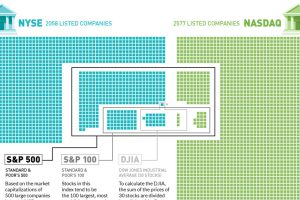
Plotting the 4,500+ companies on the NYSE and NASDAQ to show how the S&P 500, S&P 100, and Dow are derived. Read more

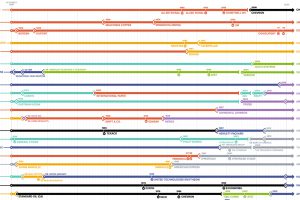
The Dow Jones Industrial Average is constantly evolving. This chart tracks which companies have come and gone since the inception of the index in 1928. Read more

It’s been a long year since the WHO declared the novel coronavirus a global pandemic. This visual looks at key events in the COVID-19 timeline. Read more

