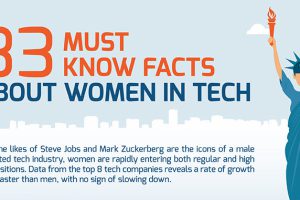
The most successful women in Silicon Valley, as well as dozens of other facts about women in technology, startups, and venture capital. Read more
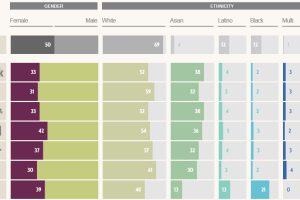
The ‘Google Manifesto’ and subsequent backlash has brought the topic of diversity to the forefront of the tech world. Here is diversity data by company. Read more
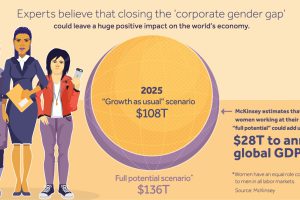
The argument for adding more women in leadership roles is a simple one: there’s a growing body of research that shows gender diversity increases profits. Read more
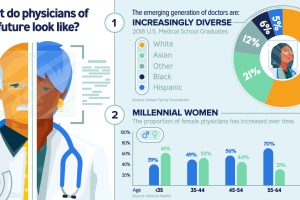
Today’s doctors are increasingly young and diverse, and skilled at using digital tools. How will they disrupt the healthcare landscape in years to come? Read more

This infographic delves into five major forces reshaping our world and the new rules of leadership that CEOs should follow as a result. Read more
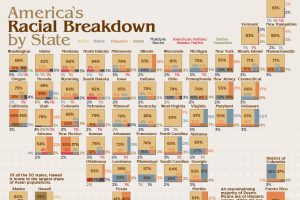
America is a cultural mosaic—nearly 40% identify as a visible minority today. Here we break down the U.S. population by race by state. Read more
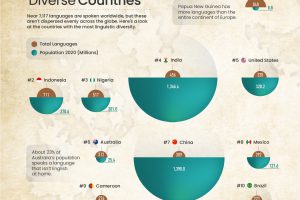
Thousands of languages are spoken globally, but they aren’t evenly dispersed. Here’s a look at countries with the most linguistic diversity. Read more
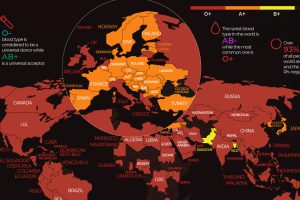
There are 8 common blood groups but 36 human blood types in total. Here we map the most widespread blood types in every country in the world. Read more
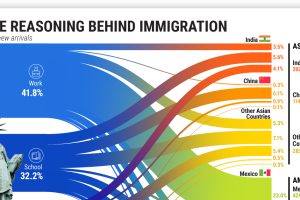
More than 45 million American residents were immigrants in 2021, having moved for various reasons. Read more

In this graphic, we show the most diverse states in the U.S. based on the Census Bureau’s Diversity Index. Read more

