

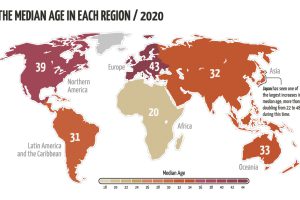
The world’s population is aging, but not at the same rate. This animated map visualizes the changes in median age in every region since 1950. Read more
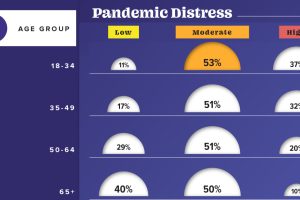
This graphic visualizes the impact of COVID-19 on emotional distress levels by different demographic subgroups such as race, education, or sex. Read more

Where are the world’s highest cities? This graphic ranks the world’s major urban centers by altitude above sea level. Read more
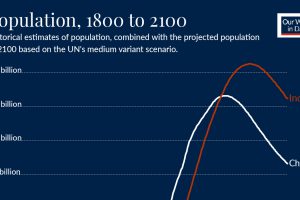
When will India’s population overtake China’s? Take a look at the trends behind this impending demographic milestone. Read more
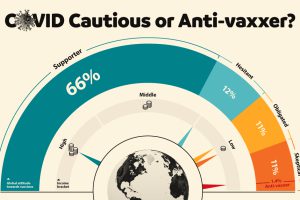
This graphic visualizes global attitudes to vaccines categorized into five segments including anti-vaxxers and COVID cautious. Read more
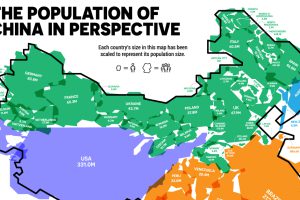
China is the world’s most populous country. But how does the population of China compare to the rest of the world? Read more
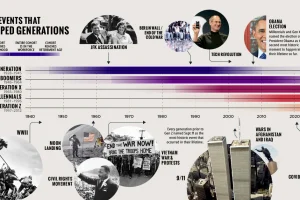
This timeline, from our Generational Power Index report, explores defining events in U.S. history that impacted each generation. Read more
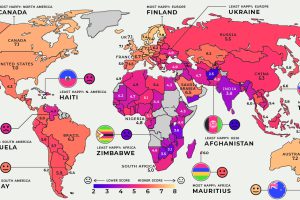
Global happiness levels are determined by many diverse factors. These maps look at the happiest and unhappiest countries in every region. Read more
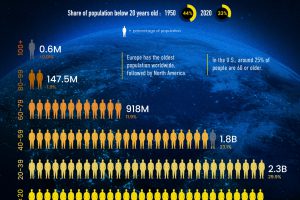
33% of the world’s population is under 20, making young people the largest demographic worldwide. But this might not be the case forever. Read more

The U.S. saw 7.4% population growth in the past decade, the lowest it’s been since the 1930s. How does population by state look today? Read more