

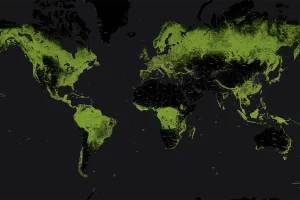
Forests cover 30% of the world’s land. These maps and charts shows where forests are flourishing, and where human activity is chipping away at the tree line. Read more
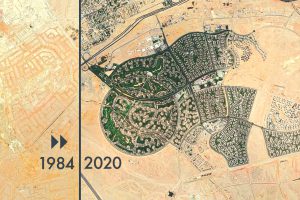
From rapid urbanization to retreating glaciers, these timelapsed satellite maps capture the drastic changes the Earth’s surface has undergone. Read more
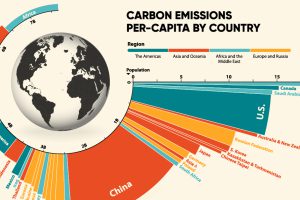
33.6 Gt of CO2 was emitted across the world in 2019. Here we visualize the global per capita CO2 emissions by country and region. Read more
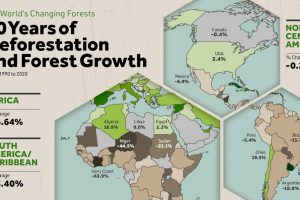
Where are the world’s forests still shrinking, and where are they seeing net gains? We map deforestation by country between 1990-2020. Read more
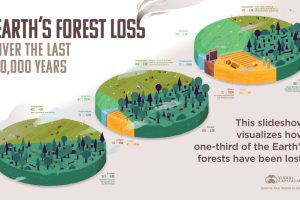
How much has the world’s land use changed over the last 10,000 years, and how have forests been impacted? Read more
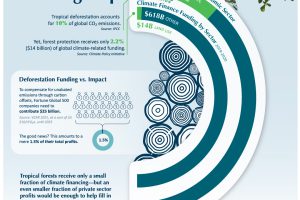
Deforestation accounts for 10% of global CO2 emissions, yet receives just a small slice of climate funding. See why closing this funding gap is necessary to combat climate change. (Sponsored) Read more
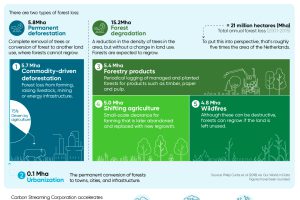
Approximately 15 billion trees are cut down annually across the world. Here’s a look at the five major drivers of forest loss. (Sponsored) Read more
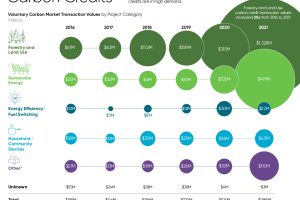
Carbon credits from nature-based solutions are in high demand as organizations look to shrink their carbon footprints. Read more
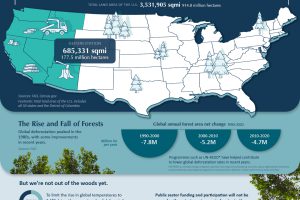
Deforestation over the last 30 years has led to a 177.5 million hectare reduction in world’s forests. See why these trends need to reverse swiftly in order to effectively manage… Read more
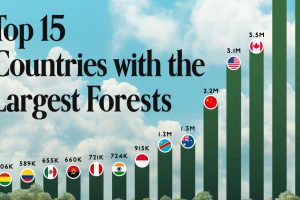
Together, the top five countries with the largest forests account for more than half of the world’s entire forest cover. Read more