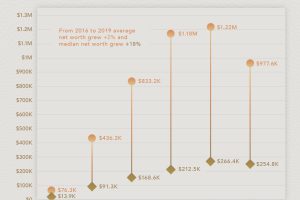
How much is the average American worth at different ages? This chart reveals the average net worth by age in the U.S. Read more

The last decade has witnessed an avalanche of investor capital gravitating towards private equity, along with much richer deal valuations. Read more

We compare net worth figures from 2010 and 2023 to uncover which countries are becoming wealthier over time. Read more

Since 2003, U.S. household debt has doubled to over $14.5 trillion. We break down the components of this colossal figure. Read more
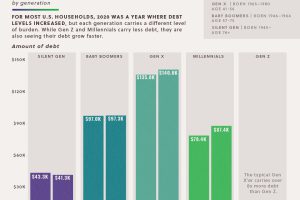
The majority of U.S. households saw debts rise in 2020. This data looks at the growth in household debt and the existing debt pile, by generation Read more
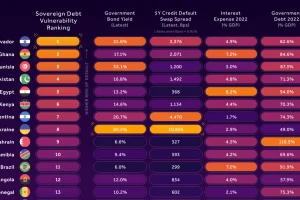
In this infographic, we examine new data that ranks the top 25 countries by their default risk. Read more

From the wealth held to billionaires to all debt in the global financial system, we look at the vast universe of money and markets in 2022. Read more

Since 2008, the value of unrecorded dollar debt has doubled. Here’s why this is increasing risk in global financial markets. Read more
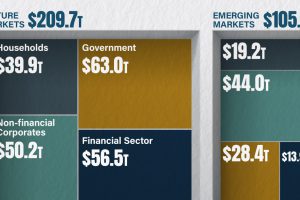
The world hit a new record of $315 trillion in global debt in Q1 2024. Which markets and sectors are leading this surge in debt? Read more

Americans’ collective credit card debt surpassed $1 trillion for the first time in 2023. Read more

