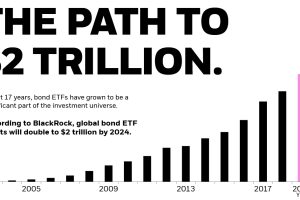
Bonds are a staple in every portfolio, but up until recently were hard to own. Here’s how bond ETFs changed that, reaching $1 trillion in global AUM. Read more
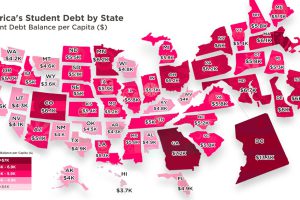
Crippling student debt in the U.S. has reached a record high of $1.5 trillion nationwide. Today’s map breaks down which states bear the highest burden. Read more

Tiny homes have grown into a multi-billion dollar industry—but is it just a millennial novelty, or a necessity for every generation? Read more
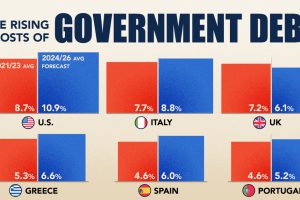
The cost of servicing the national debt is surging as high interest rates push up borrowing costs amid a rapidly growing debt pile. Read more
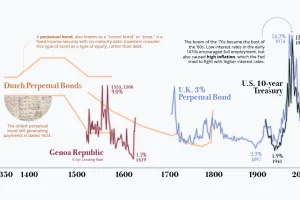
Interest rates sit near generational lows — is this the new normal, or has it been the trend all along? We show a history of interest rates in this graphic. Read more

What share of government world debt does each country owe? See it all broken down in this stunning visualization. Read more
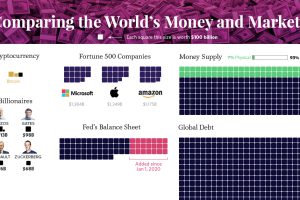
Our most famous visualization, updated for 2020 to show all global debt, wealth, money, and assets in one massive and mind-bending chart. Read more
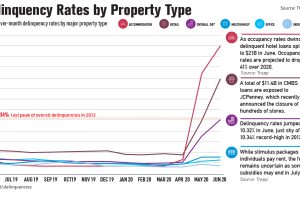
After the 2009 crisis, it took nearly 3 years for commercial mortgage delinquencies to hit record levels. In 2020, it took just 3 months. Read more
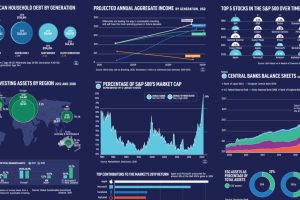
What forces will drive the future of financial markets? We reveal 15 charts from six chapters of our new book to show where the economy is heading. Read more
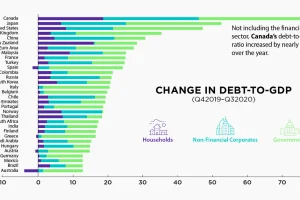
The battle against the COVID-19 pandemic has resulted in heightened debt-to-GDP levels across all sectors and countries. Read more

