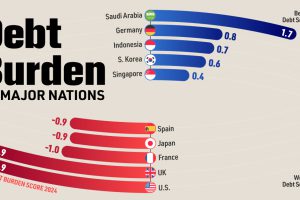
After an unprecedented borrowing spree in response to COVID-19, what does government debt look like around the world? Read more
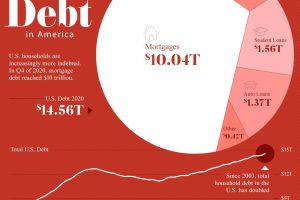
Since 2003, U.S. household debt has doubled to over $14.5 trillion. We break down the components of this colossal figure. Read more
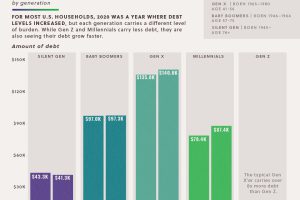
The majority of U.S. households saw debts rise in 2020. This data looks at the growth in household debt and the existing debt pile, by generation Read more

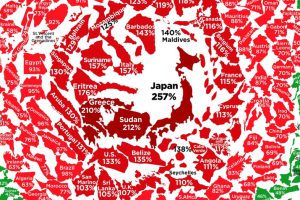
Global debt reached $226T by the end of 2020 – the biggest one-year jump since WWII. This graphic compares the debt-to-GDP ratio of various countries. Read more
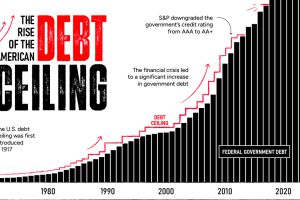
By June 1, a debt ceiling agreement must be finalized. The U.S. could default if politicians fail to act—causing many stark consequences. Read more

Global debt has soared since the pandemic. Which countries have the biggest stockpile of debt outstanding in 2023? Read more
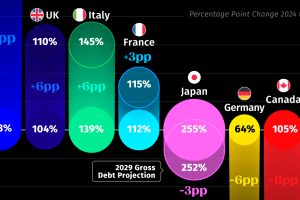
The U.S. is predicted to see the greatest accumulation in government debt among G7 countries in the next five years. Read more
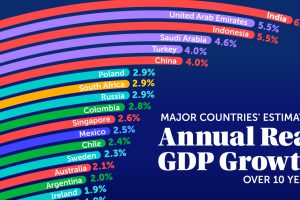
In this graphic, we show future economic prospects of major nations worldwide, based on analysis from Ray Dalio. Read more


