
See how much the debt-to-GDP ratios of advanced economies have grown (or shrank) since the year 2000. Read more

In terms of actual capacity to pay debt, the United States has the 2nd highest amount in the world. We compare debt to revenue in this data visualization. Read more
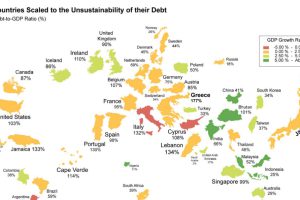
What if the world was remapped based on national debt levels? What would the largest country be? See the world map of debt. Read more

Want to know how much money the government has borrowed on your behalf? This infographic shows government debt per capita for every country in the world. Read more
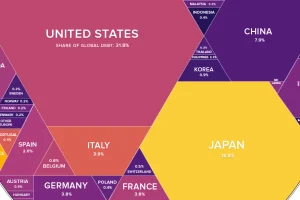
How much debt has been racked up by governments? This stunning infographic shows each country’s share of world debt, along with their debt-to-GDP ratio. Read more

The U.S. national debt is climbing at a rapid pace, increasing by $1 trillion since the start of the year alone. Read more
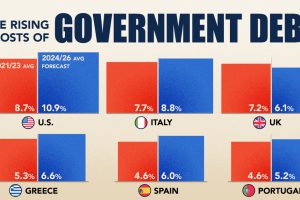
The cost of servicing the national debt is surging as high interest rates push up borrowing costs amid a rapidly growing debt pile. Read more

Global debt has soared to a new landmark, adding $1.3 trillion in debt in the first quarter of 2024 alone. Read more
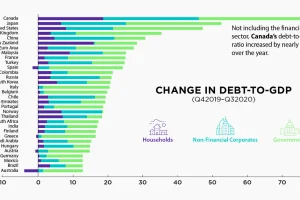
The battle against the COVID-19 pandemic has resulted in heightened debt-to-GDP levels across all sectors and countries. Read more
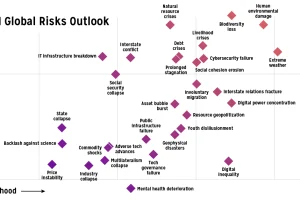
Which risks are top of mind in 2021? We visualize the World Economic Forum’s risk assessment for top global risks by impact and livelihood. Read more

