

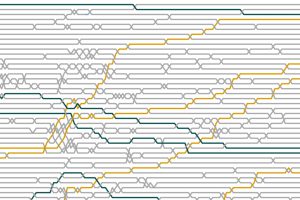
How have state populations changed over a century? This bump chart shows the population rank of every state in the United States over 1917-2017. Read more
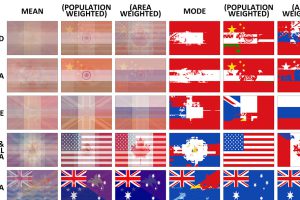
The average flag of the world, as well as different continents, if every flag were combined together. Also, a look at the building blocks of flag design. Read more

How a devastating series of cholera outbreaks in the 19th century inadvertently spurred innovation in the field of data visualization. Read more
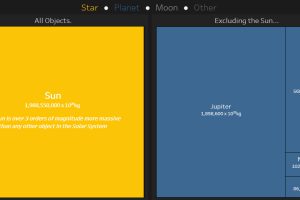
This interactive data visualization illustrates how the different planetary objects in our solar system compare based on their individual masses. Read more
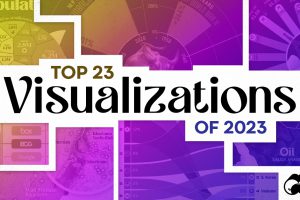
What were the top data visualizations on Visual Capitalist in 2023? We highlight the best charts, maps, and infographics from the year. Read more