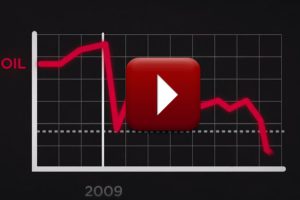
This infographic video shows the story behind oil’s plunge through 2014. Read more

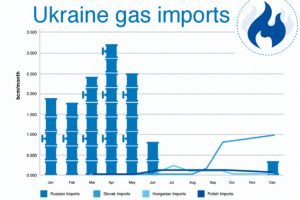
Looking back on 2014, this infographic sums up the major changes occurring in energy markets in oil, renewables, sanctions, and more. Read more

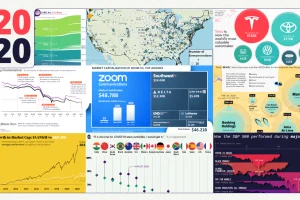
These 20 charts, maps, and visualizations help capture what happened in a tumultuous year around the globe. Read more

