
Visualizing the share of COVID-19 vaccines purchased by different countries and the companies that are manufacturing them. Read more
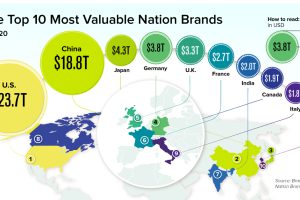
Here’s a look at the most valuable nation brands in 2020, and how the brand values of these countries have changed over time. Read more
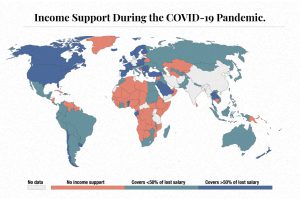
The need for income support during COVID-19 has been vast. This map visualizes different levels of income support around the world. Read more
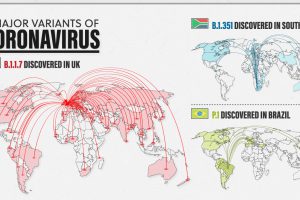
New variants of COVID-19 are spreading fast around the world. Here’s a look at the 3 major ones and how they differ from one another. Read more
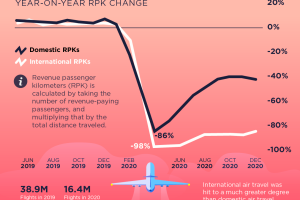
In spring 2020, roughly two-thirds of the world’s passenger jets were grounded. Here’s how things have rebounded since the onset of the pandemic. Read more
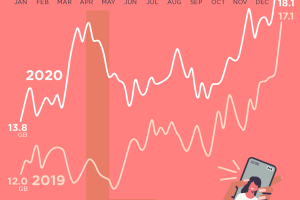
Data usage across America peaked in April 2020, but reached relatively normal levels by the end of the year. Read more
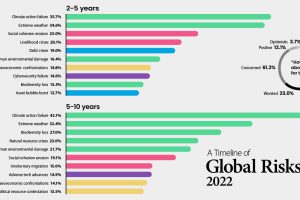
Which risks are top of mind in 2022? We visualize the World Economic Forum’s global risk assessment for top risks by impact and livelihood. Read more
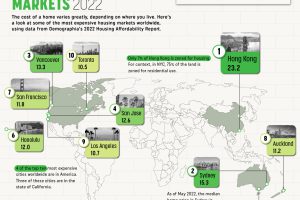
An analysis of 90+ major cities reveals which ones are the least affordable housing markets based on their price-to-income ratio. Read more
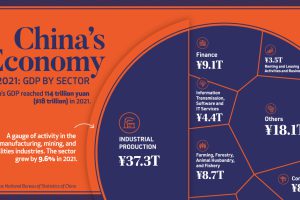
China’s economy reached a GDP of 114 trillion yuan ($18 trillion) in 2021, well above government targets. What sectors drove that growth? Read more

