

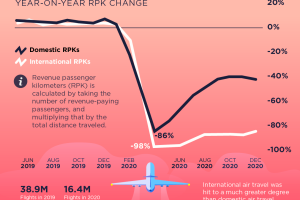
In spring 2020, roughly two-thirds of the world’s passenger jets were grounded. Here’s how things have rebounded since the onset of the pandemic. Read more
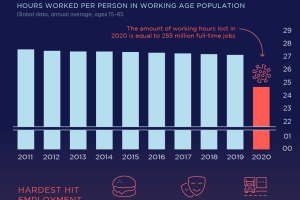
The pandemic has impacted employment greatly. This visual reveals how its effects have led to losses in hours worked by global workers in 2020. Read more

It’s been a long year since the WHO declared the novel coronavirus a global pandemic. This visual looks at key events in the COVID-19 timeline. Read more
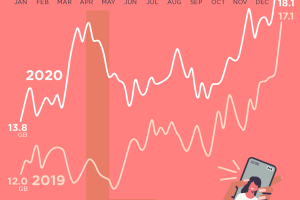
Data usage across America peaked in April 2020, but reached relatively normal levels by the end of the year. Read more
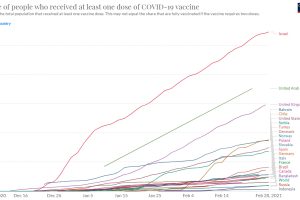
Vaccine rollouts are underway, but how quickly are COVID-19 vaccines being administered? This charts follows vaccine administration globally. Read more
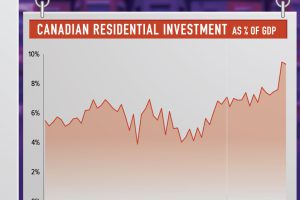
Canada’s housing market is booming. Residential real estate investment currently makes up 9.4% of the country’s GDP, more than ever before. Read more
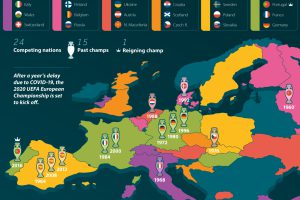
After a year-long delay, the 2020 UEFA European Championship is back with new rules, reduced spectators, and fierce competition. Read more

This infographic examines trends in each generation’s media consumption to see how Americans adapted during the pandemic. Read more

1.6 billion face masks entered our oceans in 2020, representing 5,500 tons of plastic pollution. Read more
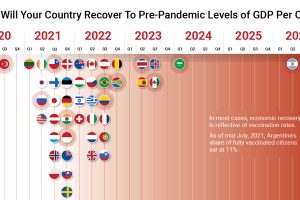
The path to COVID-19 recovery varies worldwide—some countries have already recovered, while others will not be back to normal for years. Read more