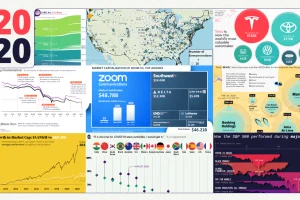
These 20 charts, maps, and visualizations help capture what happened in a tumultuous year around the globe. Read more
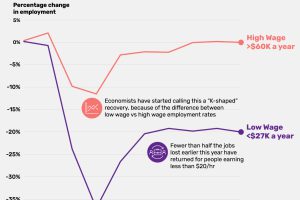
The current recession is the most unequal in modern history, with employment rates diverging greatly between high versus low wage workers. Read more
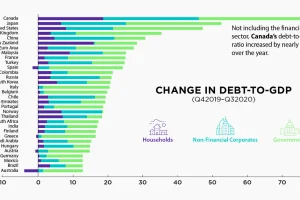
The battle against the COVID-19 pandemic has resulted in heightened debt-to-GDP levels across all sectors and countries. Read more

This graphic compares consumers’ most loved brands before the COVID-19 pandemic to their most loved brands during the pandemic. Read more
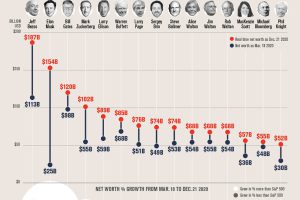
The net worth of some American Billionaires has grown substantially since the COVID-19 market bottom. Here’s how much their fortunes grew. Read more
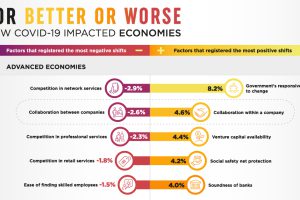
It’s been a rollercoaster year. Here’s a look at the economic impact of COVID-19 worldwide, according to a survey of global business leaders. Read more
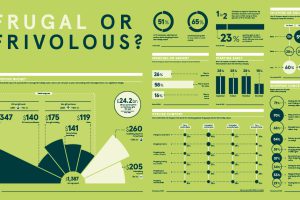
This graphic explores how festive spending in 2020 has changed as a result of the ongoing COVID-19 pandemic and evolving consumer behavior. Read more
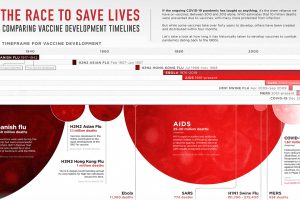
This graphic looks at how long vaccine development has historically taken for pandemics dating back to the 1900s. Read more
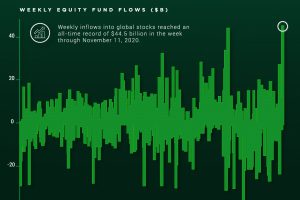
Investor optimism regarding vaccine news and the U.S. presidential election has led to record breaking inflows into the stock market. Read more


