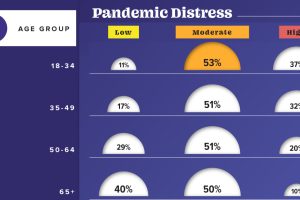
This graphic visualizes the impact of COVID-19 on emotional distress levels by different demographic subgroups such as race, education, or sex. Read more
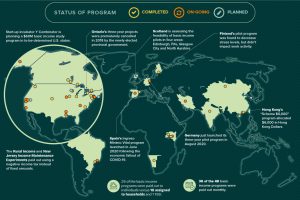
Amid the pandemic, the idea of Universal Basic Income has been gaining steam with policymakers. Where has it been tried, and has it worked? Read more
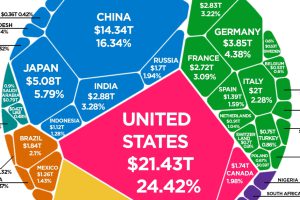
The world’s total GDP crested $88 trillion in 2019—but how are the current COVID-19 economic contractions affecting its future outlook? Read more
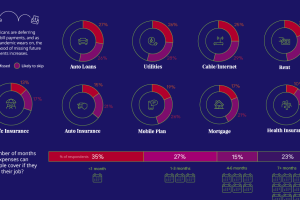
57% of U.S. consumers’ incomes have taken a hit during the pandemic. How do such financial anxieties affect the ability to pay bills on time? Read more
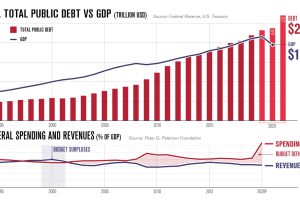
America’s debt recently surpassed $27 trillion. In this infographic, we peel back the layers to understand why it keeps on growing. Read more
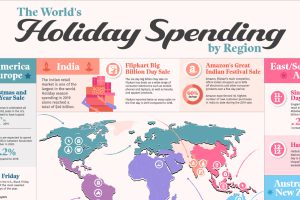
This graphic illustrates some of the largest and most anticipated retail holidays by region and explores their origins. Read more
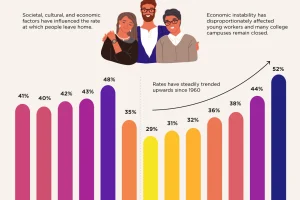
Today 52% of young adults aged 18-29 live with their parents. Economic and societal factors have played a part in addition to the COVID-19. Read more
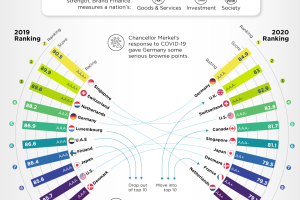
Each year, Brand Finance measures the value and strength of nations around the world. Here’s a look at the strongest nation brands in 2020. Read more

While a majority of remote workers have been enjoying the flexibility of working from home, it hasn’t come without its challenges. Read more


