

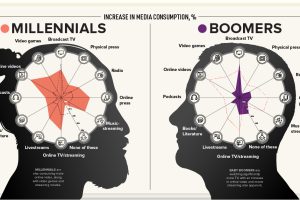
This visualization explores how each generation’s media consumption is changing amid the frenzy of pandemic-induced quarantines. Read more
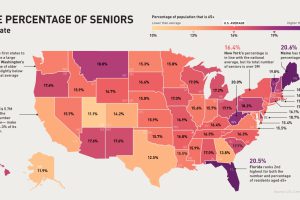
The U.S. senior population is much more vulnerable to COVID-19. Which states and cities have the most people in this at-risk age group? Read more
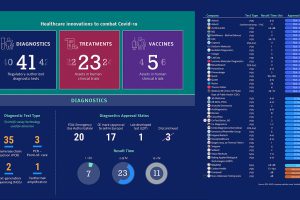
As the number of confirmed COVID-19 cases continues to skyrocket, healthcare researchers around the world are working to defeat the virus. Read more
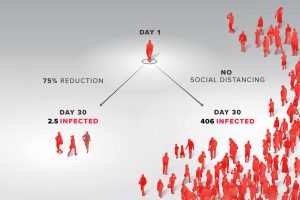
Social distancing has been the first line of defense against COVID-19. We look at the math and science behind social distancing, to show how it works. Read more
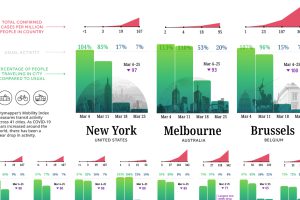
Amid the COVID-19 crisis, cities are dramatically slowing down. Today’s chart demonstrates the impact of lockdowns on commuter activity worldwide. Read more
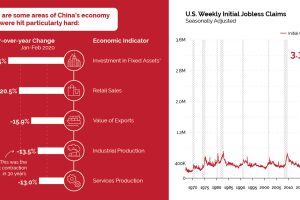
China has seen a severe economic impact from COVID-19, and it may be a preview of what’s to come for countries in the early stages of the outbreak. Read more
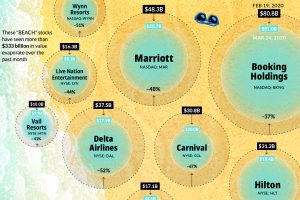
As investor confidence across the travel industry slumps amid COVID-19, market capitalizations across ‘BEACH’ stocks shrink to unprecedented levels. Read more
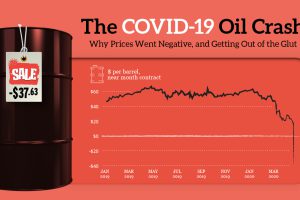
How oil prices went negative: this explainer shows how a collapse in demand, a Saudi-Russia price war, and oversupply led to futures prices going wonky. Read more

This infographic explores five key behaviors that CEOs and executives should adopt in order to demonstrate leadership accountability in times of crisis. Read more
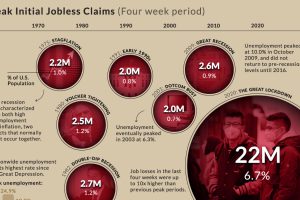
In the last four weeks, 22 million Americans filed initial jobless claims. Here’s how that staggering number compares to the peaks of past recessions. Read more