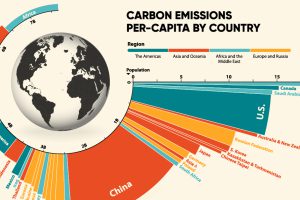
33.6 Gt of CO2 was emitted across the world in 2019. Here we visualize the global per capita CO2 emissions by country and region. Read more

In 2020, solar power saw its largest-ever annual capacity expansion at 127 gigawatts. Here’s a snapshot of solar power capacity by country. Read more

Coal came under scrutiny for its high carbon emissions at COP26, but many countries are forecasted to increase coal production until 2024. Read more

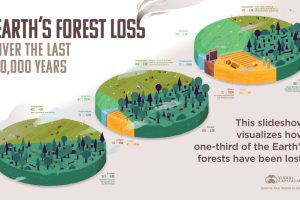
How much has the world’s land use changed over the last 10,000 years, and how have forests been impacted? Read more

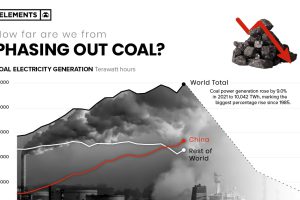
In 2021 coal-fired electricity generation reached all-time highs, rising 9% from the year prior. Here’s what it’d take to phase it out of the energy mix. Read more

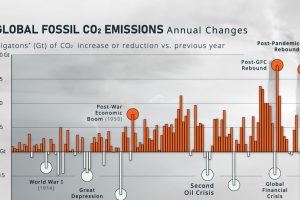
How much do global CO₂ emissions change on a year-to-year basis? Here, we show the annual rate of change in emissions since 1900. Read more

