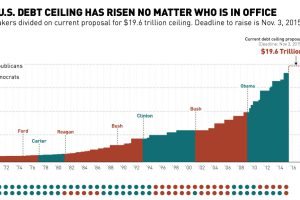
This chart shows the history of the U.S. debt ceiling from 1970 until today, including the current proposal to increase it to $19.6 trillion. Read more

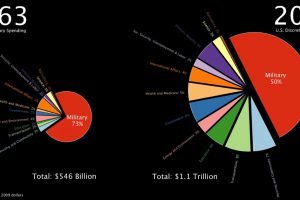
This stunning one minute animation breaks down U.S. government discretionary spending from 1963 all the way until today. Read more

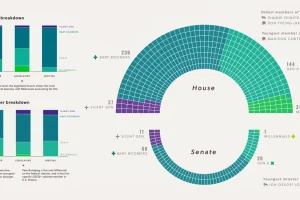
Visual Capitalist’s inaugural Generational Power Index (GPI) examines the political power held by each generation and their influence on society. Read more

This graphic visualizes the top donors to Ukraine between January 2022, and July 2023. Read more

Donald Trump, Mitt Romney, J.B. Pritzker. This infographic is a snapshot of the richest politicians in the U.S. Read more

