

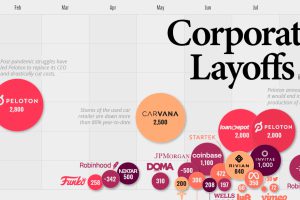
This infographic highlights the accelerating pace of layoffs so far in 2022, as businesses cut costs ahead of a potential recession. Read more
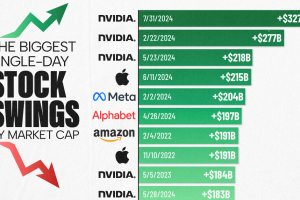
One company dominates this ranking of the biggest single-day stock swings in U.S. history. Read more
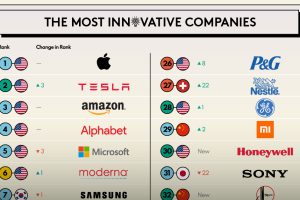
Which companies prioritize innovation the most? This infographic highlights BCG’s 2023 Most Innovative Companies ranking. Read more
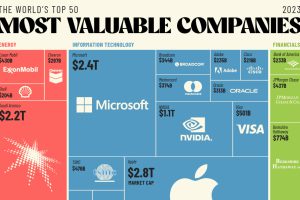
The world’s 50 most valuable companies represent over $25 trillion in market cap. We break this massive figure down by company and sector. Read more
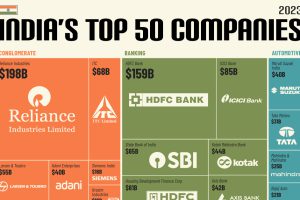
What are India’s top companies? This graphic showcases the country’s largest 50 publicly traded companies by market capitalization. Read more
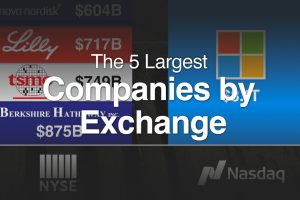
With trillion dollar valuations becoming more common, we’ve compared the five biggest companies by stock exchange. Read more
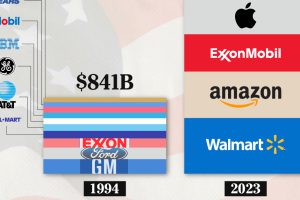
We compare America’s top 10 companies by revenue in 1994 and 2023 to see how the business landscape has changed. Read more
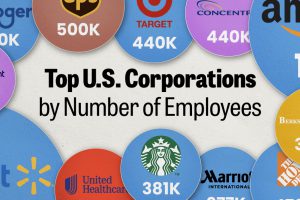
We visualized the top U.S. companies by employees, revealing the massive scale of retailers like Walmart, Target, and Home Depot. Read more
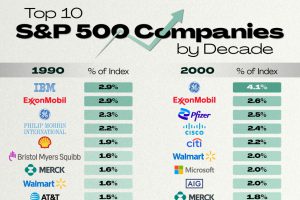
We look at the top S&P 500 companies since 1990 to highlight how the American economy has evolved over time. Read more
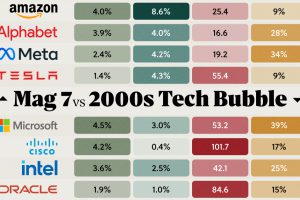
We visualized key stock metrics to see how the Magnificent 7 compares to seven of the top stocks from the 2000s tech bubble. Read more