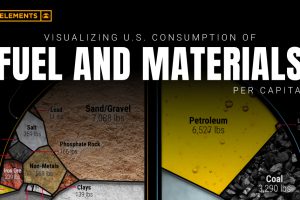
Visualizing U.S. Consumption of Fuel and Materials per Capita

Wealthy countries consume large amounts of natural resources per capita, and the U.S. is no exception. See how much is used per person. Read more

Visualizing China’s Dominance in Battery Manufacturing (2022-2027P)

This infographic breaks down battery manufacturing capacity by country in 2022 and 2027. Read more
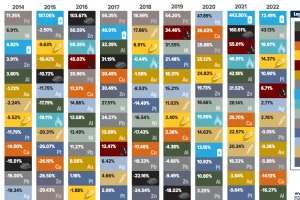
The Periodic Table of Commodity Returns (2013-2022)

This table shows the fluctuating returns for various commodities over the past decade, from energy fuels to industrial and precious metals. Read more

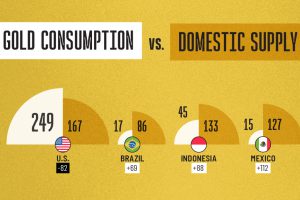
Visualizing Gold Consumption vs. Domestic Supply

India’s consumption is 50 times higher than its domestic supply. Read more

The Fastest Rising Asset Classes in 2023

Asset classes vary widely by returns so far in 2023. Which ones are the best-performing, and is a bull market on the horizon? Read more
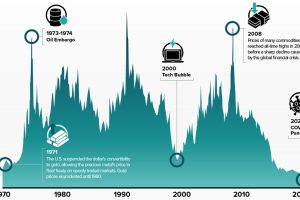
Charted: Commodities vs Equity Valuations (1970–2023)

The commodities-to-equities ratio recently hit a 50-year low. In the past, when this ratio reached such levels, commodity supercycles began. Read more

How Big is the Market for Crude Oil?

The oil market is bigger than the 10 largest metal markets combined, with production value exceeding $2 trillion annually. Read more

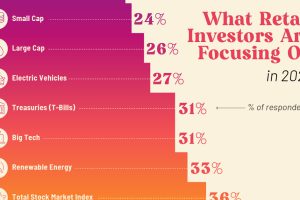
Charted: What are Retail Investors Interested in Buying in 2023?

What key themes and strategies are retail investors looking at for the rest of 2023? Preview: AI is a popular choice. Read more
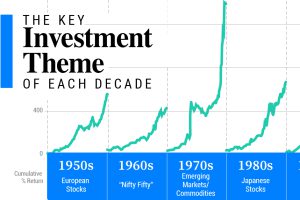
Charted: The Key Investment Theme of Each Decade (1950-Today)

Here are the investment themes that have defined each decade from the ‘Nifty Fifty’ to the tech giants of the 2010s. Read more

The Critical Minerals to China, EU, and U.S. National Security

Ten materials, including cobalt, lithium, graphite, and rare earths, are deemed critical by all three. Read more